

HOT TOPICS LIST
- MACD
- Fibonacci
- RSI
- Gann
- ADXR
- Stochastics
- Volume
- Triangles
- Futures
- Cycles
- Volatility
- ZIGZAG
- MESA
- Retracement
- Aroon
INDICATORS LIST
LIST OF TOPICS
PRINT THIS ARTICLE
by Donald W. Pendergast, Jr.
Gold mining shares continue to show weakness. Should traders focus on the gold exchange traded fund or on individual gold stocks?
Position: N/A
Donald W. Pendergast, Jr.
Donald W. Pendergast is a financial markets consultant who offers specialized services to stock brokers and high net worth individuals who seek a better bottom line for their portfolios.
PRINT THIS ARTICLE
REL. STR COMPARATIVE
Relative Strength In The Gold Mining Stocks
06/28/12 09:33:37 AMby Donald W. Pendergast, Jr.
Gold mining shares continue to show weakness. Should traders focus on the gold exchange traded fund or on individual gold stocks?
Position: N/A
| Precious metals (PM) mining stock traders tend to be an enthusiastic bunch. Many like to digest as much PM market news as they can handle and also have a bias toward trading with at least some amount of fundamental bias in their trading activities. Others simply rely on mechanical trading systems to time their respective entries and exits, while still others mix a variety of technical, fundamental, and seasonal factors into their PM stock trading model to guide their market activities. One of the best ways to trade the gold stock niche of the PM market is to focus on one of the major gold stock exchange traded funds (ETFs), the Market Vectors Gold Miners ETF (GDX), but if you're willing to handle a bit more risk and volatility, you can also elect to trade individual gold mining shares. Here's a look at a smaller gold miner's stock action now. This stock could be setting up for more downside as the summer progresses. See Figures 1, 2, and 3. |
|
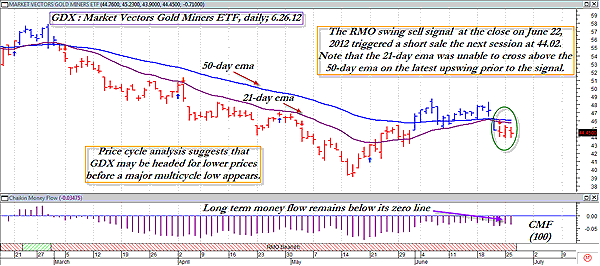
| FIGURE 1: GDX, DAILY. The fact that the latest RMO (Rahul Mohindar) swing sell signal hasn't moved prices much lower may give short sellers in Seabridge Gold extra time to get set up on their own short trade. |
| Graphic provided by: MetaStock. |
| Graphic provided by: RMO indicators from MetaStock 11. |
| |
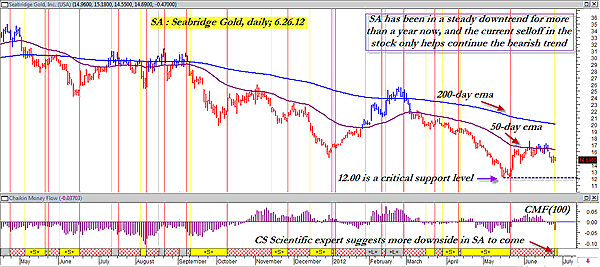
| GDX had a very sharp decline since making a significant swing high in late February 2012 -- and is still down by more than 23%. Meanwhile, Seabridge Gold (SA) is down by more than 42% during the same time span, mired in a long-term downtrend that shows no sign of abating anytime soon. SA trades with much less average daily volume than GDX (a few hundred thousand shares daily versus more than seven million a day for GDX), making short sales in SA more risky (due to a higher probability of violent short squeezes), but for traders with the stomach to handle the higher volatility may also come the possibility of higher returns. Here's the current daily chart status for SA: 1. The long-term and near-term trends are down. 2. The CS Scientific expert advisor (yellow ribbon at the bottom of Figure 2) from MetaStock 11 suggests that the line of least resistance in the stock is toward lower prices. 3. Long-term money flow is negative, based on the 100-day Chaikin money flow (CMF)(100) histogram. 4. SA is severely underperforming GDX over the past 13 weeks. 5. The next strong chart support level in SA doesn't occur until the $12.00 per share level. Given all of this bearishness, here's a short-term, take it or leave it, trade idea for shorting SA: 1. Risking no more than 1% of your account equity, place a sell-stop market order to go short if SA declines to 14.53. 2. If filled on the order, immediately place a stop-loss (good till cancelled) at 15.42 and then begin namaging the trade with a two-bar trailing stop of the daily highs until the final stopout. 3. If SA quickly falls and approaches the $12.00 area before stopping out first, consider taking half of your trade off and continue to run the same trailing stop for the remainder of the trade's life. An added bonus to this trade setup is that GDX recently issued a major RMO swing sell signal but has not moved too far south as of this writing. If the bears get more interested in following through with shorting GDX, those already short shares of SA should be well positioned for a ride to lower per share valuations -- and probably sooner rather than later. PM mining shares tend to be flat to down during the early to mid- summer months, so this could be a good trade setup for motivated, savvy traders with a fair amount of short selling success under their belts. |
|
| FIGURE 2: SA, DAILY. Is Seabridge Gold looking to make a double bottom soon? Or is the stock destined to decline to under $12.00 before its next multicycle low is finally made? |
| Graphic provided by: MetaStock. |
| Graphic provided by: CS Scientific expert from MetaStock 11. |
| |
|
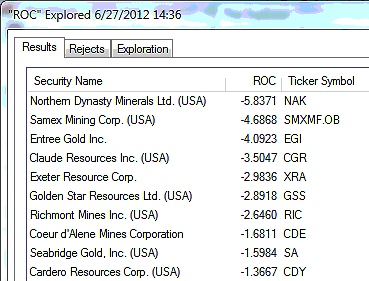
| FIGURE 3: UNDERPERFORMING PRECIOUS METALS STOCKS. Ten PM stocks that are far underperforming GDX and .HUI over the last 13 weeks. Be aware that several of these stocks are thinly traded and/or trade at under $5.00 per share. |
| Graphic provided by: MetaStock. |
| Graphic provided by: MetaStock Explorer. |
| |
Donald W. Pendergast is a financial markets consultant who offers specialized services to stock brokers and high net worth individuals who seek a better bottom line for their portfolios.
| Title: | Writer, market consultant |
| Company: | Linear Trading Systems LLC |
| Jacksonville, FL 32217 | |
| Phone # for sales: | 904-239-9564 |
| E-mail address: | lineartradingsys@gmail.com |
Traders' Resource Links | |
| Linear Trading Systems LLC has not added any product or service information to TRADERS' RESOURCE. | |
Click here for more information about our publications!
PRINT THIS ARTICLE

Request Information From Our Sponsors
- StockCharts.com, Inc.
- Candle Patterns
- Candlestick Charting Explained
- Intermarket Technical Analysis
- John Murphy on Chart Analysis
- John Murphy's Chart Pattern Recognition
- John Murphy's Market Message
- MurphyExplainsMarketAnalysis-Intermarket Analysis
- MurphyExplainsMarketAnalysis-Visual Analysis
- StockCharts.com
- Technical Analysis of the Financial Markets
- The Visual Investor
- VectorVest, Inc.
- Executive Premier Workshop
- One-Day Options Course
- OptionsPro
- Retirement Income Workshop
- Sure-Fire Trading Systems (VectorVest, Inc.)
- Trading as a Business Workshop
- VectorVest 7 EOD
- VectorVest 7 RealTime/IntraDay
- VectorVest AutoTester
- VectorVest Educational Services
- VectorVest OnLine
- VectorVest Options Analyzer
- VectorVest ProGraphics v6.0
- VectorVest ProTrader 7
- VectorVest RealTime Derby Tool
- VectorVest Simulator
- VectorVest Variator
- VectorVest Watchdog