HOT TOPICS LIST
- MACD
- Fibonacci
- RSI
- Gann
- ADXR
- Stochastics
- Volume
- Triangles
- Futures
- Cycles
- Volatility
- ZIGZAG
- MESA
- Retracement
- Aroon
INDICATORS LIST
LIST OF TOPICS
PRINT THIS ARTICLE
by Donald W. Pendergast, Jr.
The .OEX had a minor bounce on June 26, but is it enough to ignite more bullish follow-through?
Position: N/A
Donald W. Pendergast, Jr.
Donald W. Pendergast is a financial markets consultant who offers specialized services to stock brokers and high net worth individuals who seek a better bottom line for their portfolios.
PRINT THIS ARTICLE
TECHNICAL ANALYSIS
PENDY'S PICKS: June 27, 2012
06/27/12 02:40:05 PMby Donald W. Pendergast, Jr.
The .OEX had a minor bounce on June 26, but is it enough to ignite more bullish follow-through?
Position: N/A
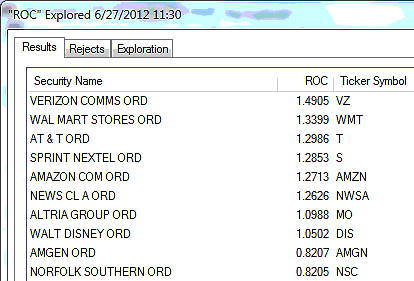
| The .OEX (Standard & Poor's 100) turned slightly higher on Tuesday, closing at 605.08 as its higher price cycles attempted to keep the rally out of the early June 2012 swing low moving higher. The lack of range made the move suspect, however, and traders need to be on the lookout for violent moves in either direction -- particularly on the downside, especially over the next week or two as the shorter-term cycles attempt to put in a meaningful low in the index. Figure 1 is a look at the strongest 13-week relative strength performers in the .OEX. Telecoms still remain strong, with AT&T (T) and Verizon (VZ) gaining relative strength, even as Sprint Nextel (S) continues to hang tough. Wal-Mart Stores (WMT) have begun to climb in the ranking, and if 68.92 is broken to the upside, a new long buy signal will be triggered in the retail giant's stock. NewsCorp (NWSA) has now moved into the top-performing 13-week relative strength list; shares shot higher on Tuesday on news of a possible restructuring of the company into two distinct divisions. |

|
| FIGURE 1: STRONGEST .OEX COMPONENTS. The 10 strongest S&P 100 (.OEX) components that have been outperforming the .OEX over the past calendar quarter as of Tuesday, June 26, 2012. |
| Graphic provided by: MetaStock. |
| Graphic provided by: MetaStock Explorer. |
| |
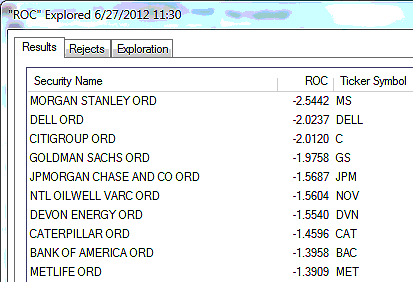
| Figure 2 is a look at the weakest 13-week relative strength performers in the .OEX; of these 10 weakest large caps, six of them are from the financial sector -- JP Morgan Chase (JPM), Goldman Sachs (GS), Citigroup (C), Bank of America (BAC), Morgan Stanley (MS), and MetLife (MET) are all certainly names to keep an eye on, especially once the broad markets manage to make a multicycle low. They could all be explosive performers to the upside, should that occur in conjunction with a meaningful (rather than another patch job) solution to the euro debt mess implemented over the next several months. |

|
| FIGURE 2: WEAKEST .OEX COMPONENTS. The 10 weakest S&P 100 (.OEX) components that have been underperforming the .OEX over the past calendar quarter as of Tuesday, June 26, 2012. |
| Graphic provided by: MetaStock. |
| Graphic provided by: MetaStock Explorer. |
| |
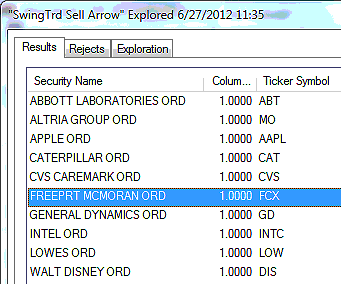
| Figure 3 are the S&P 100 components giving RMO swing sell signals; there was only one RMO swing buy signal (a long RMO swing buy signal in WMT) as of Tuesday's close. A full 11% of the .OEX components issued new RMO swing sell signals on Tuesday, which was rather unusual, given the minor uptick in the .OEX. Of major interest is the new RMO swing sell signal in shares of Freeport-McMoran Copper and Gold (FCX); this will trigger a short sale on a drop below 31.41. Price cycle analysis in FCX reveals that if the 30.00 level is broken soon, the stock may be on track to keep heading south, finally bottoming out in the teens sometime in the spring of 2013. FCX is a key player in the metals mining sphere, and as this stock goes, so most likely will the rest of the mining industry stocks. |

|
| FIGURE 3: RMO SWING SELL SIGNALS. The S&P 100 (.OEX) components issuing RMO swing sell signals at the close of trading on Tuesday, June 26, 2012; 10% of all .OEX components fired sell signals during this session, with shares of Wal-Mart Stores (WMT) managing to fire a new buy signal. |
| Graphic provided by: MetaStock. |
| Graphic provided by: MetaStock Explorer. |
| |
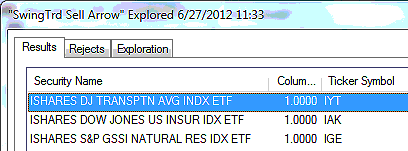
| Figure 4 are the three exchange traded funds (ETFs) from major industry groups or sectors that are flashing new RMO swing sell signals. The iShares Transportation (IYT), Insurance (IAK), and Natural Resources (IGE) ETFs will all trigger new short sales on declines below their respective Tuesday lows. Once again, there were no new RMO swing buy signals in any of the ETFs that this report regularly tracks. |

|
| FIGURE 4: THREE ETFS. The three ETFs that have fired new RMO swing sell signals as of the close of trading on Tuesday, June 26, 2012. Note the diversity of industry groups represented here. |
| Graphic provided by: MetaStock. |
| Graphic provided by: MetaStock Explorer. |
| |
| With the .OEX still attempting to sort out its near-term directional bias, traders will be best served by either standing aside until the index flashes a new sell signal and/or it can manage a daily close above 623.52, its June 19, 2012, swing high. Alternatively, traders might also consider culling the list of strong/weak relative strength performers listed in this article and scanning for low-risk intraday swing trades, closing out all positions by the end of the trading session. Until more significant news of a true euro debt solution emerges, be sure to keep a close eye on all of your open positions in the market, as this could be a very turbulent summer in the financial markets worldwide. |
Donald W. Pendergast is a financial markets consultant who offers specialized services to stock brokers and high net worth individuals who seek a better bottom line for their portfolios.
| Title: | Writer, market consultant |
| Company: | Linear Trading Systems LLC |
| Jacksonville, FL 32217 | |
| Phone # for sales: | 904-239-9564 |
| E-mail address: | lineartradingsys@gmail.com |
Traders' Resource Links | |
| Linear Trading Systems LLC has not added any product or service information to TRADERS' RESOURCE. | |
Click here for more information about our publications!
PRINT THIS ARTICLE

Request Information From Our Sponsors
- VectorVest, Inc.
- Executive Premier Workshop
- One-Day Options Course
- OptionsPro
- Retirement Income Workshop
- Sure-Fire Trading Systems (VectorVest, Inc.)
- Trading as a Business Workshop
- VectorVest 7 EOD
- VectorVest 7 RealTime/IntraDay
- VectorVest AutoTester
- VectorVest Educational Services
- VectorVest OnLine
- VectorVest Options Analyzer
- VectorVest ProGraphics v6.0
- VectorVest ProTrader 7
- VectorVest RealTime Derby Tool
- VectorVest Simulator
- VectorVest Variator
- VectorVest Watchdog
- StockCharts.com, Inc.
- Candle Patterns
- Candlestick Charting Explained
- Intermarket Technical Analysis
- John Murphy on Chart Analysis
- John Murphy's Chart Pattern Recognition
- John Murphy's Market Message
- MurphyExplainsMarketAnalysis-Intermarket Analysis
- MurphyExplainsMarketAnalysis-Visual Analysis
- StockCharts.com
- Technical Analysis of the Financial Markets
- The Visual Investor
