

HOT TOPICS LIST
- MACD
- Fibonacci
- RSI
- Gann
- ADXR
- Stochastics
- Volume
- Triangles
- Futures
- Cycles
- Volatility
- ZIGZAG
- MESA
- Retracement
- Aroon
INDICATORS LIST
LIST OF TOPICS
PRINT THIS ARTICLE
by Donald W. Pendergast, Jr.
Will this new sell signal in shares of National Oilwell Varco lead to a continuation move to even lower prices?
Position: Sell
Donald W. Pendergast, Jr.
Donald W. Pendergast is a financial markets consultant who offers specialized services to stock brokers and high net worth individuals who seek a better bottom line for their portfolios.
PRINT THIS ARTICLE
TRADING SYSTEMS
Raff Sell Signal For National Oilwell Varco
06/28/12 09:17:57 AMby Donald W. Pendergast, Jr.
Will this new sell signal in shares of National Oilwell Varco lead to a continuation move to even lower prices?
Position: Sell
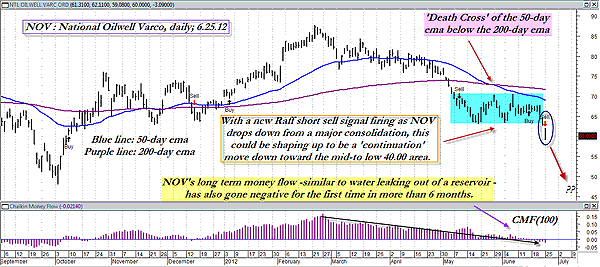
| It's no big surprise to learn that the entire energy sector has been in a heavy downtrend for the last couple of months; crude oil prices are now trading below $80 per barrel and stocks from the energy industry groups have been also been hit hard. The iShares DJones US Oil Equipment and Services ETF (IEZ) is down by more than 29% since making a major swing high on February 24, 2012, for example. One stock that has also taken a major drubbing is National Oilwell Varco (NOV), which is down even more in percentage terms than IEZ, and this major energy sector player is now manifesting a chart pattern that suggests that even more downside is a very high probability. Here's a closer look now (Figure 1). |
|
| FIGURE 1: NOV, DAILY. An image of a near-textbook quality, post-death cross continuation move is presented here on NOV's daily chart. |
| Graphic provided by: MetaStock. |
| Graphic provided by: Raff MarketSpace expert from MetaStock 11. |
| |
| After making a major swing high on February 22, 2012, NOV proceeded into a long-term decline, dropping all the way from $87.72 to $59.08 (as of June 25, 2012); that's a drop of more than 32%. Before dropping that far, however, NOV made a death cross (its 50-day exponential moving average [EMA] crossed its 200-day EMA to the downside on May 30, 2012) before putting in a very nicely formed consolidation pattern, one that lasted about six weeks and kept prices in an $8.00 range between $63 and $71. This had the potential to be a base-building, bottom formation, but with the major plunge south from the range on Monday, the most likely diagnosis for NOV is that the stock is destined to drop further before finding meaningful support, especially given the textbook-quality continuation pattern that has begun to manifest on its daily chart. Simply put, if a stock (exchange traded fund, futures market, and so on) makes a sustained swing and/or trend move and then goes into a meaningful consolidation or range-bound phase, after which it proceeds to break out from said range in the direction of the original swing/trend move prior to the consolidation, the theory is that the stock has a high probability of making further moves in the direction of the original, prerange bound move. In this case, that's what appears to be happening to shares of NOV. And since there is approximately a $22.50 spread between the $87.72 high and the center of the consolidation (approximately $67), the nominal price target for a successful continuation move in NOV is down toward the $45 area until the dynamics on the chart suggest otherwise. Long-term money flow, as evidenced by the 100-period Chaikin money flow histogram (CMF)(100), reveals that the smart money has been selling out of their long NOV positions since early December 2011 and that the money flow trend is still in a decidedly bearish mode as of this writing. |
|
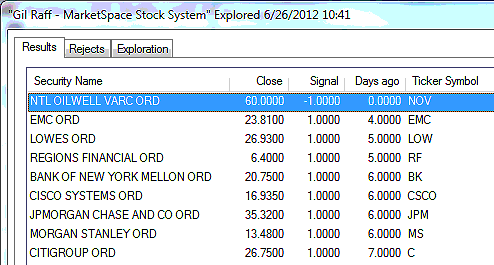
| FIGURE 2: S&P 100 COMPONENTS. The Standard & Poor's 100 component stocks that have fired various long/short Raff MarketSpace Stock system trading signals over the past seven trading sessions. |
| Graphic provided by: MetaStock. |
| Graphic provided by: MetaStock Explorer. |
| |
| The real item of actionable interest is, of course, the new Raff MarketSpace Stock system short sale signal, one that triggers on a decline to $59.07. While the stock has tremendous downside momentum, if you do choose to trade this short setup, you may want to run a fairly close trailing stop -- perhaps a three-bar trailing stop of the daily highs -- in order to lock in any potential gains quickly and to also help limit the damage caused by any possible short-covering rallies. See Figure 2. Be aware that NOV also has a major support level at $47.97 (the October 4, 2012, swing low) and you definitely want to be running a close trailing stop if this current short setup manages to take NOV down that far. Selling puts is not recommended in this stock at this time, unless you really want to be assigned 100 shares of NOV at the strike price of your choice. For example, as of this writing you can sell a NOV July '12 55.00 July put option for about $0.81 (that's $81 per contract, before commissions and slippage). If NOV falls to say, 50.00 by the close of trading on July 20, 2012, your trading account will be debited for $5,500 plus commissions and you will be the proud owner of 100 shares of NOV. You'll also keep the $81 in premiums collected when you sold the 55.00 put. However, you would also be $500 underwater on top of all of that: (55.00 - 50.00) * 100 = (-$500). So, unless you are ultraconfident that NOV will soon rebound and start to rally again or you are simply desirous of owning this stock at a beaten-down price, then it's probably a good idea to discard any ideas of put selling and/or bottom picking at this time. However you decide to trade NOV here, always use wise position sizing of no more than 1% to 2% per trade. |
Donald W. Pendergast is a financial markets consultant who offers specialized services to stock brokers and high net worth individuals who seek a better bottom line for their portfolios.
| Title: | Writer, market consultant |
| Company: | Linear Trading Systems LLC |
| Jacksonville, FL 32217 | |
| Phone # for sales: | 904-239-9564 |
| E-mail address: | lineartradingsys@gmail.com |
Traders' Resource Links | |
| Linear Trading Systems LLC has not added any product or service information to TRADERS' RESOURCE. | |
Click here for more information about our publications!
PRINT THIS ARTICLE

Request Information From Our Sponsors
- VectorVest, Inc.
- Executive Premier Workshop
- One-Day Options Course
- OptionsPro
- Retirement Income Workshop
- Sure-Fire Trading Systems (VectorVest, Inc.)
- Trading as a Business Workshop
- VectorVest 7 EOD
- VectorVest 7 RealTime/IntraDay
- VectorVest AutoTester
- VectorVest Educational Services
- VectorVest OnLine
- VectorVest Options Analyzer
- VectorVest ProGraphics v6.0
- VectorVest ProTrader 7
- VectorVest RealTime Derby Tool
- VectorVest Simulator
- VectorVest Variator
- VectorVest Watchdog
- StockCharts.com, Inc.
- Candle Patterns
- Candlestick Charting Explained
- Intermarket Technical Analysis
- John Murphy on Chart Analysis
- John Murphy's Chart Pattern Recognition
- John Murphy's Market Message
- MurphyExplainsMarketAnalysis-Intermarket Analysis
- MurphyExplainsMarketAnalysis-Visual Analysis
- StockCharts.com
- Technical Analysis of the Financial Markets
- The Visual Investor