HOT TOPICS LIST
- MACD
- Fibonacci
- RSI
- Gann
- ADXR
- Stochastics
- Volume
- Triangles
- Futures
- Cycles
- Volatility
- ZIGZAG
- MESA
- Retracement
- Aroon
INDICATORS LIST
LIST OF TOPICS
PRINT THIS ARTICLE
by David Penn
From a February bottom of 0.8560 to a recent high of 0.9560, the euro has climbed chart pattern after chart pattern on its way up.
Position: N/A
David Penn
Technical Writer for Technical Analysis of STOCKS & COMMODITIES magazine, Working-Money.com, and Traders.com Advantage.
PRINT THIS ARTICLE
TRIANGLES
The Euro: Triangles, Flags and More Triangles
06/20/02 10:02:20 AMby David Penn
From a February bottom of 0.8560 to a recent high of 0.9560, the euro has climbed chart pattern after chart pattern on its way up.
Position: N/A
| I don't think enough can be said about looking for chart patterns in the breakouts from other chart patterns. If you believe that chart patterns are simply common expressions of the battle between buyers and sellers -- whether these patterns are head and shoulders tops, or hanging man candlesticks, or even just pullbacks to major trendlines or moving averages -- then finding a successful chart pattern in a price action series can be a tip-off that the tradable under consideration has a fairly common reaction to both bullish and bearish breakouts. As Jesse Livermore noted in his book "How to Trade in Stocks," "Stocks, like individuals, have a character and a personality. Some are high-strung, nervous, and jumpy -- others are forthright, direct, logical. A skillful trader comes to know and respect individual securities. Their action is predictable under varying sets of conditions." |
| The same applies, generally speaking, to currency pairs. And Livermore's remarks clearly apply to the EURUSD currency pair under discussion here. |

|
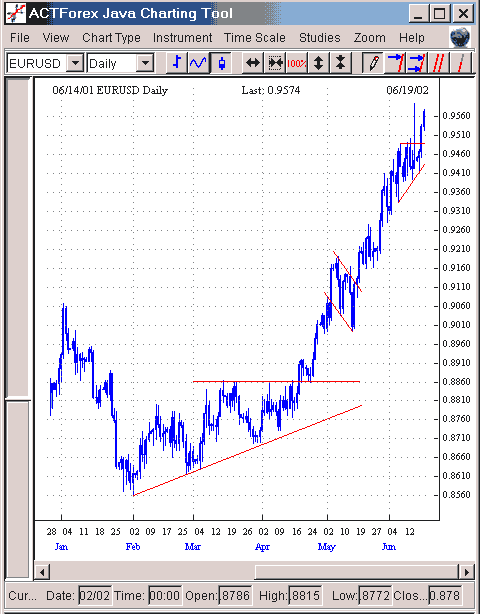
| Figure 1: The euro's spring advance has moved from breakout to breakout, courtesy of two ascending triangles and a bullish flag. |
| Graphic provided by: ACTForex Java Charts. |
| |
| Note how the EURUSD declined in January, finally putting in a bottom at the end of the month. From that point, EURUSD began making a series of higher lows at the beginning of March, the end of April, and again in mid-April. At the same time, EURUSD was meeting resistance at 0.8860 during rallies in both March and April. This pattern of steadily higher lows and flat, or consistent highs suggests an ascending triangle, a bullish formation from which the breakout is anticipated to be on the upside. Generally speaking, ascending triangles are continuation formations, meaning they tend to develop during trends that have already begun, and serve as accumulation areas in advance of a renewed climb. However, I have been struck by the number of ascending triangle-like formations that have been bottoms -- the most striking one in recent memory being the ascending triangle in crude oil that developed in January and February of this year, a triangle whose breakout took crude up nearly 30% in March. This may be less shocking than it appears, however. A number of observers have noted that triangles often strongly resemble head and shoulders formations. EURUSD broke out from its ascending triangle at 0.8860 in mid-April. There was a brief, four-day pullback in the form of a flag immediately after the breakout which both helped confirm the breakout (by turning the 0.8660 area into new support), as well as provided another opportunity for discriminating bulls to buy. The minimum price target for the triangle (0.8860 less 0.8610, and that amount added to 0.8660) was reached in May, when EURUSD hit 0.9110. At that time, EURUSD once again corrected, forming another flag as price retreated from a rally high just shy of 0.9210 to stop at 0.9010. |
| The breakout from this bullish flag came in mid-May as EURUSD broke out above the top trendline of the flag at 0.9110. The way to determine the minimum price objective from a flag breakout is to measure the distance from the previous breakout to the beginning of the formation. In this case, a minimum price target of 0.9310. This minimum price target was reached less than eleven days after the breakout. |
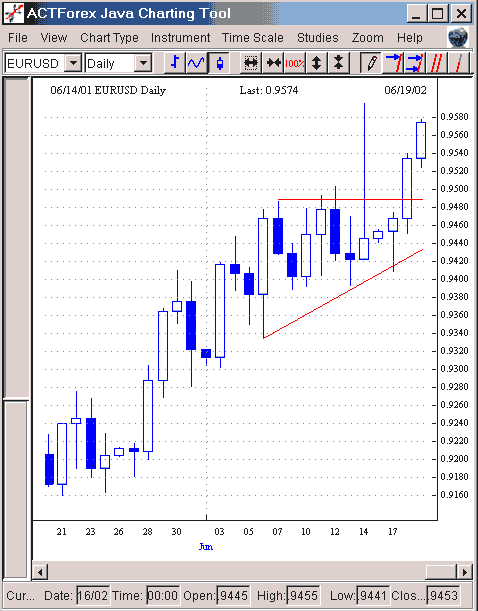
It now appears that EURUSD has entered and emerged from still yet another triangle -- this time in early June. Relative to the previous, "bottoming" ascending triangle, the June ascending triangle is much smaller -- lasting only ten trading days before breaking out. But in most other respects it better resembles a "classic" ascending triangle that the February-March-April triangle discussed above. Figure 2: This June ascending triangle suggests there is still some room on the upside for EURUSD. Where can EURUSD longs expect the breakout from the June ascending triangle to take them? The formation size of this ascending triangle is about 150 pips which, when added to the resistance area of 0.9490, provides for a minimum target price of 0.9640. |
Technical Writer for Technical Analysis of STOCKS & COMMODITIES magazine, Working-Money.com, and Traders.com Advantage.
| Title: | Technical Writer |
| Company: | Technical Analysis, Inc. |
| Address: | 4757 California Avenue SW |
| Seattle, WA 98116 | |
| Phone # for sales: | 206 938 0570 |
| Fax: | 206 938 1307 |
| Website: | www.Traders.com |
| E-mail address: | DPenn@traders.com |
Traders' Resource Links | |
| Charting the Stock Market: The Wyckoff Method -- Books | |
| Working-Money.com -- Online Trading Services | |
| Traders.com Advantage -- Online Trading Services | |
| Technical Analysis of Stocks & Commodities -- Publications and Newsletters | |
| Working Money, at Working-Money.com -- Publications and Newsletters | |
| Traders.com Advantage -- Publications and Newsletters | |
| Professional Traders Starter Kit -- Software | |
Click here for more information about our publications!
Comments
Date: 06/25/02Rank: 5Comment:

Request Information From Our Sponsors
- VectorVest, Inc.
- Executive Premier Workshop
- One-Day Options Course
- OptionsPro
- Retirement Income Workshop
- Sure-Fire Trading Systems (VectorVest, Inc.)
- Trading as a Business Workshop
- VectorVest 7 EOD
- VectorVest 7 RealTime/IntraDay
- VectorVest AutoTester
- VectorVest Educational Services
- VectorVest OnLine
- VectorVest Options Analyzer
- VectorVest ProGraphics v6.0
- VectorVest ProTrader 7
- VectorVest RealTime Derby Tool
- VectorVest Simulator
- VectorVest Variator
- VectorVest Watchdog
- StockCharts.com, Inc.
- Candle Patterns
- Candlestick Charting Explained
- Intermarket Technical Analysis
- John Murphy on Chart Analysis
- John Murphy's Chart Pattern Recognition
- John Murphy's Market Message
- MurphyExplainsMarketAnalysis-Intermarket Analysis
- MurphyExplainsMarketAnalysis-Visual Analysis
- StockCharts.com
- Technical Analysis of the Financial Markets
- The Visual Investor
