HOT TOPICS LIST
- MACD
- Fibonacci
- RSI
- Gann
- ADXR
- Stochastics
- Volume
- Triangles
- Futures
- Cycles
- Volatility
- ZIGZAG
- MESA
- Retracement
- Aroon
INDICATORS LIST
LIST OF TOPICS
PRINT THIS ARTICLE
by James Kupfer
What does a review of current Elliott wave counts reveal? A short-term buy, but what else?
Position: Sell
James Kupfer
Mr. Kupfer is a market professional and amateur stock market commentator. Disclosure: It is likely that Mr. Kupfer has or will enter a position in any security he writes about.
PRINT THIS ARTICLE
ELLIOTT WAVE
Elliott Wave Analysis Of $SPX
06/29/12 08:45:40 AMby James Kupfer
What does a review of current Elliott wave counts reveal? A short-term buy, but what else?
Position: Sell
| Elliott wave analysis is a technical analysis system that holds that all markets move in a specific price pattern, regardless of time scale. In other words, prices are fractal and without knowing the time scale of a particular price graph, we could not tell if it were daily, weekly, or intraday. |
| Elliott wave analysis identified impulse and corrective waves. Impulse waves move in five waves, while corrective waves move in three waves. Impulse waves are numbered 1-5, while corrective waves are labeled A, B, and C. Since EW analysis is fractal in nature, there are corrective waves imbedded in impulse waves and impulse waves imbedded in corrective waves. Unfortunately, EW analysis is so complex that it simply cannot be covered in any great depth in the space of an article. |
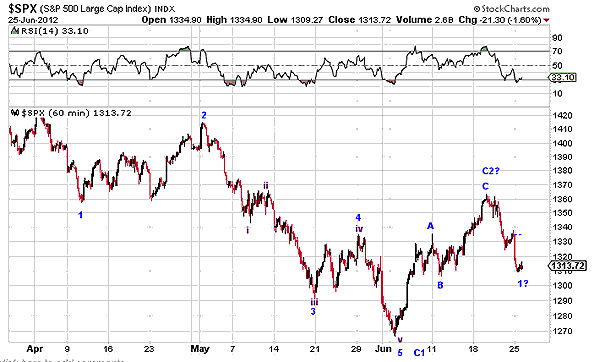
| Fortunately, even a simplistic EW analysis can be useful in determining where any stock or market may move. In Figure 1, I have labeled a potential wave count for the SPX. The numbers in blue show the primary impulse wave down; the blue letters show the corrective wave that started after 5. As a further example of how EW analysis can work in a fractal sense, I have labeled in purple a five-wave impulse within the 2-3 impulse wave. |

|
| FIGURE 1: $SPX, HOURLY. We seem to have completed the first significant leg down, labeled C1. We also quite likely completed C2, which means we have now started leg 3 down. |
| Graphic provided by: StockCharts.com. |
| |
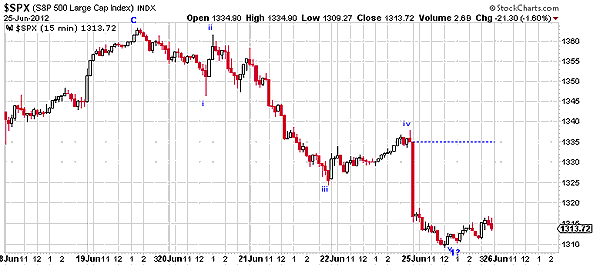
| As you can see, it appears that we have completed corrective wave C. In all likelihood, that means that we should now begin a new impulse wave down that is part of a larger impulse wave down. Figure 2 is what I suspect the current wave count is. If this is correct, we have just begun an ABC corrective pattern that will likely move the SPX to between 1330 and 1346 before starting back down again. |

|
| FIGURE 2: $SPX, 15-MINUTE. This closeup view of the market over the last few days indicates that we should get a brief upward retracement followed by a further large move down well below 1310. |
| Graphic provided by: StockCharts.com. |
| |
| Unfortunately, EW analysis is more art than science and there are very few rules in EW, just many guidelines. The patterns shown here are proposed wave counts. Until more time passes, it is impossible to confirm them. Regardless, EW can be a useful tool in identifying possible inflection points and current market direction. |
Mr. Kupfer is a market professional and amateur stock market commentator. Disclosure: It is likely that Mr. Kupfer has or will enter a position in any security he writes about.
Click here for more information about our publications!
Comments

Request Information From Our Sponsors
- StockCharts.com, Inc.
- Candle Patterns
- Candlestick Charting Explained
- Intermarket Technical Analysis
- John Murphy on Chart Analysis
- John Murphy's Chart Pattern Recognition
- John Murphy's Market Message
- MurphyExplainsMarketAnalysis-Intermarket Analysis
- MurphyExplainsMarketAnalysis-Visual Analysis
- StockCharts.com
- Technical Analysis of the Financial Markets
- The Visual Investor
- VectorVest, Inc.
- Executive Premier Workshop
- One-Day Options Course
- OptionsPro
- Retirement Income Workshop
- Sure-Fire Trading Systems (VectorVest, Inc.)
- Trading as a Business Workshop
- VectorVest 7 EOD
- VectorVest 7 RealTime/IntraDay
- VectorVest AutoTester
- VectorVest Educational Services
- VectorVest OnLine
- VectorVest Options Analyzer
- VectorVest ProGraphics v6.0
- VectorVest ProTrader 7
- VectorVest RealTime Derby Tool
- VectorVest Simulator
- VectorVest Variator
- VectorVest Watchdog
