HOT TOPICS LIST
- MACD
- Fibonacci
- RSI
- Gann
- ADXR
- Stochastics
- Volume
- Triangles
- Futures
- Cycles
- Volatility
- ZIGZAG
- MESA
- Retracement
- Aroon
INDICATORS LIST
LIST OF TOPICS
PRINT THIS ARTICLE
by Koos van der Merwe
Netflix has been a volatile stock over the past year. Is it worth investing in?
Position: Accumulate
Koos van der Merwe
Has been a technical analyst since 1969, and has worked as a futures and options trader with First Financial Futures in Johannesburg, South Africa.
PRINT THIS ARTICLE
MA ENVELOPES
Netflix Signals A Buy
06/29/12 01:48:46 PMby Koos van der Merwe
Netflix has been a volatile stock over the past year. Is it worth investing in?
Position: Accumulate
| Talk of Netflix (NFLX) has been on everyone's lips over the past year, reaching a high of $304.79 on July 29, 2011, and then falling to a low of $62.37 by November 30, 2011. Management has made mistakes, and contracts with companies that supplied them with movies have expired and not been renewed. Movies and TV shows offered by them, although plentiful, are not up to date. For the moviegoer who wants to watch the latest movie out there, Netflix is not the answer. Yet we should not forget that they were part of the trend to put Blockbusters out of business. Are they a company worth investing in, or is there too much opposition now? |

|
| FIGURE 1: NFLX, MONTHLY |
| Graphic provided by: AdvancedGET. |
| |
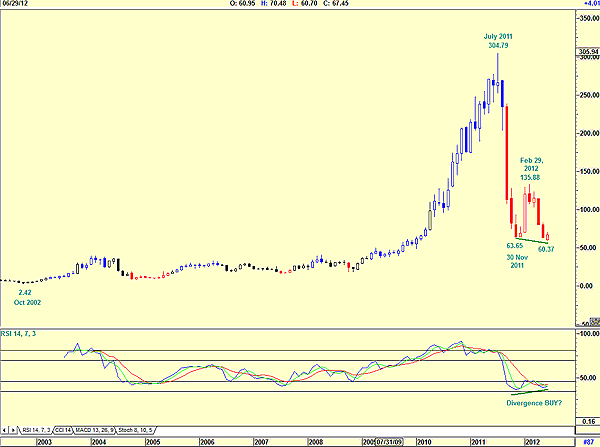
| Figure 1 is a monthly chart and shows how the price moved from a low of $2.42 in October 2002 to a high of $304.79 by July 2011. From this high, the price dropped dramatically to $63.65 by November 30, 2011. The chart shows how the price then rose to $135.88 on a relative strength index (RSI) buy signal and promptly fell to $60.37 with the RSI still in buy territory, suggesting a possible divergence buy. What does the daily chart suggest? |

|
| FIGURE 2: NFLX, DAILY |
| Graphic provided by: AdvancedGET. |
| |
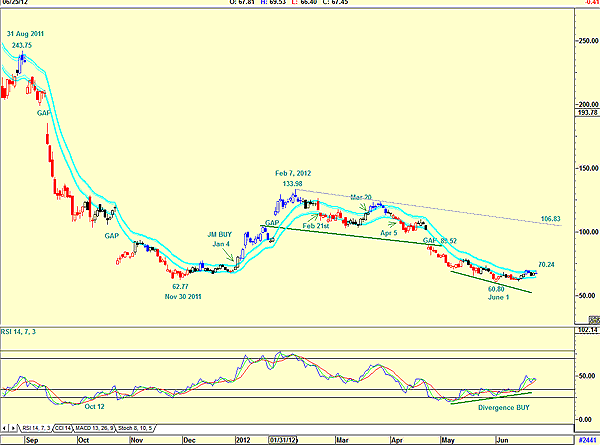
| The daily chart in Figure 2 shows how the price fell from a high on August 31, 2011, to gaps at a low of $62.77 by November 30, 2011. The RSI started suggesting a buy signal as early as October 12, but this was not confirmed by the JM internal band indicator, which only gave a buy signal on January 4 when the RSI was in overbought territory. The price continued rising and on a gap to a high of $133.98 by February 7, 2012. A JM sell signal was given on February 21 with a fresh JM buy signal on March 20 that failed as the RSI continued falling. A new JM sell signal was given on April 5, and the price fell on a gap to a low of $60.80 by June 1. The RSI is suggesting a divergence buy and the share price has moved up, but it has not given a JM internal band buy signal. With what appears to be the formation of a double bottom, I suggest that we should only consider buying should the price break above $106.83. With the RSI rising and finally with the JM internal band indicator suggesting a buy should the price break above the upper band at $70.24, the stock does indeed look interesting. |
Has been a technical analyst since 1969, and has worked as a futures and options trader with First Financial Futures in Johannesburg, South Africa.
| Address: | 3256 West 24th Ave |
| Vancouver, BC | |
| Phone # for sales: | 6042634214 |
| E-mail address: | petroosp@gmail.com |
Click here for more information about our publications!
PRINT THIS ARTICLE

Request Information From Our Sponsors
- StockCharts.com, Inc.
- Candle Patterns
- Candlestick Charting Explained
- Intermarket Technical Analysis
- John Murphy on Chart Analysis
- John Murphy's Chart Pattern Recognition
- John Murphy's Market Message
- MurphyExplainsMarketAnalysis-Intermarket Analysis
- MurphyExplainsMarketAnalysis-Visual Analysis
- StockCharts.com
- Technical Analysis of the Financial Markets
- The Visual Investor
- VectorVest, Inc.
- Executive Premier Workshop
- One-Day Options Course
- OptionsPro
- Retirement Income Workshop
- Sure-Fire Trading Systems (VectorVest, Inc.)
- Trading as a Business Workshop
- VectorVest 7 EOD
- VectorVest 7 RealTime/IntraDay
- VectorVest AutoTester
- VectorVest Educational Services
- VectorVest OnLine
- VectorVest Options Analyzer
- VectorVest ProGraphics v6.0
- VectorVest ProTrader 7
- VectorVest RealTime Derby Tool
- VectorVest Simulator
- VectorVest Variator
- VectorVest Watchdog
