HOT TOPICS LIST
- MACD
- Fibonacci
- RSI
- Gann
- ADXR
- Stochastics
- Volume
- Triangles
- Futures
- Cycles
- Volatility
- ZIGZAG
- MESA
- Retracement
- Aroon
INDICATORS LIST
LIST OF TOPICS
PRINT THIS ARTICLE
by Donald W. Pendergast, Jr.
Being aware of major price cycles and key areas of support and resistance in your favorite stocks can help you stay abreast of potentially profitable price moves.
Position: N/A
Donald W. Pendergast, Jr.
Donald W. Pendergast is a financial markets consultant who offers specialized services to stock brokers and high net worth individuals who seek a better bottom line for their portfolios.
PRINT THIS ARTICLE
CYCLES
Major Support Test Soon For FCX?
06/29/12 08:39:42 AMby Donald W. Pendergast, Jr.
Being aware of major price cycles and key areas of support and resistance in your favorite stocks can help you stay abreast of potentially profitable price moves.
Position: N/A
| Most precious metals/mining stock traders already know that shares of Freeport-McMoran Copper and Gold (FCX) tend to make sharp, sustained, swing and/or trend moves several times a year and that getting on the right side of such powerful moves can be profitable. The latest multicycle analysis projections for FCX suggest that more substantial downside moves are probable, especially if a critical weekly support level is violated on a closing basis. |

|
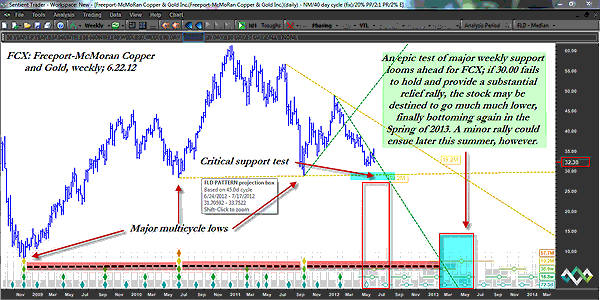
| FIGURE 1: FCX, WEEKLY. Even though a minor multicycle low is due within four to six weeks, note that the next truly major low isn't anticipated until the spring of 2013. There is a major multicycle low every 18 months or so in shares of FCX; will this cyclical pattern also play out according to the same time schedule? |
| Graphic provided by: Sentient Trader. |
| |
| Metals mining giant Freeport-McMoran Copper and Gold, based in Phoenix, AZ, is one of the few mining companies to make the Standard & Poor's 500 roster, along with Newmont Mining (NEM), and tends to be much more volatile than most of its large-cap brethren in the .SPX by a factor of nearly two. Its beta is actually 2.3, meaning that over the last 12 months, the stock has been 130% more volatile than the .SPX. Astute traders know that high-beta stocks tend to make the best swing trading (and trend-following) candidates, and FCX is certainly not lacking in terms of explosive price move potential. At present, FCX is homing in on key support at the 30.00 level; Figure 1 shows that two prior major multicycle lows were formed on each of the last major selloffs (the yellow horizontal line on the chart, which also happens to be the 36-month cycle support line). Traders in FCX need to watch for the following kinds of price action over the next four to six weeks: 1. If FCX makes a weekly close below $30 and a meaningful relief rally back up toward the $35 to $40 area hasn't commenced, look for a minor cycle low to be put in by late July to mid-August 2012 (see the first vertical red box on the chart). A decent short-covering rally becomes a good possibility, if the current downdraft continues as is. 2. If scenario 1 plays out, then be aware that the next major multicycle low (similar to those seen in December 2008, June 2010, and October 2011) isn't expected until sometime around May to August of 2013 (see the second red box on the chart). If, as this technician expects, a major commodities collapse is already under way, the valuation of FCX at that anticipated major 2013 multicycle low could be less than half of what it's trading at today, possibly in the mid-teens. The long term cycles in FCX are still heavily bearish, so keep that in mind as you seek to capitalize on both minor and major swing moves in this super-volatile metals issue. Skilled options traders should have a veritable field day if they are able to align themselves with the dominant cyclical forces that drive this and most other metals mining issues. |

|
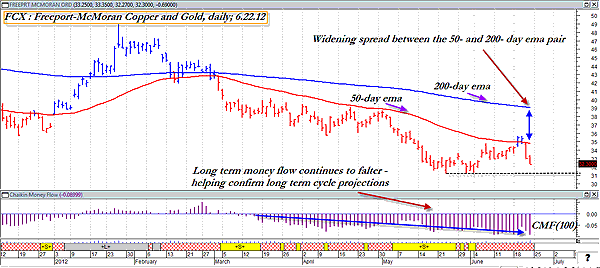
| FIGURE 2: FCX, DAILY. Long-term money flow continues to disintegrate, lending more credibility to the cyclical projections in the previous chart. If $31.25 breaks soon (black dashed line), look for the major $30.00 support level to be tested sooner rather than later. |
| Graphic provided by: MetaStock. |
| Graphic provided by: CS Scientific expert from MetaStock 11. |
| |
| So the bottom line here is that you need to keep tabs on FCX's price action near the $30 area, especially on your daily and weekly charts, and especially if $30 is reached between now and early August. If it does, see if the stock catches much of a bid -- on heavy volume, of course. See Figure 2. Ride any short-covering rallies for quick, short-term profits and then prepare for what could be substantially profitable shorting ops in FCX in late 2012 on through the first half of 2013. As always, use a proven mechanical trading system to time your actual entries and exits, letting major support/resistance levels and price cycles keep you on the side of the market with the highest probability of follow-through. No matter how bullish/bearish any particular trade setup looks on your charts, always limit the risk to your trading account to no more than 1% or 2%, tops. |
Donald W. Pendergast is a financial markets consultant who offers specialized services to stock brokers and high net worth individuals who seek a better bottom line for their portfolios.
| Title: | Writer, market consultant |
| Company: | Linear Trading Systems LLC |
| Jacksonville, FL 32217 | |
| Phone # for sales: | 904-239-9564 |
| E-mail address: | lineartradingsys@gmail.com |
Traders' Resource Links | |
| Linear Trading Systems LLC has not added any product or service information to TRADERS' RESOURCE. | |
Click here for more information about our publications!
Comments

|

Request Information From Our Sponsors
- StockCharts.com, Inc.
- Candle Patterns
- Candlestick Charting Explained
- Intermarket Technical Analysis
- John Murphy on Chart Analysis
- John Murphy's Chart Pattern Recognition
- John Murphy's Market Message
- MurphyExplainsMarketAnalysis-Intermarket Analysis
- MurphyExplainsMarketAnalysis-Visual Analysis
- StockCharts.com
- Technical Analysis of the Financial Markets
- The Visual Investor
- VectorVest, Inc.
- Executive Premier Workshop
- One-Day Options Course
- OptionsPro
- Retirement Income Workshop
- Sure-Fire Trading Systems (VectorVest, Inc.)
- Trading as a Business Workshop
- VectorVest 7 EOD
- VectorVest 7 RealTime/IntraDay
- VectorVest AutoTester
- VectorVest Educational Services
- VectorVest OnLine
- VectorVest Options Analyzer
- VectorVest ProGraphics v6.0
- VectorVest ProTrader 7
- VectorVest RealTime Derby Tool
- VectorVest Simulator
- VectorVest Variator
- VectorVest Watchdog
