HOT TOPICS LIST
- MACD
- Fibonacci
- RSI
- Gann
- ADXR
- Stochastics
- Volume
- Triangles
- Futures
- Cycles
- Volatility
- ZIGZAG
- MESA
- Retracement
- Aroon
INDICATORS LIST
LIST OF TOPICS
PRINT THIS ARTICLE
by Chaitali Mohile
Duke Energy Corp. has been offering good buying opportunities for all types of traders and investors.
Position: Hold
Chaitali Mohile
Active trader in the Indian stock markets since 2003 and a full-time writer. Trading is largely based upon technical analysis.
PRINT THIS ARTICLE
CHART ANALYSIS
Duke Energy In Long-Term Uptrend
06/29/12 01:33:47 PMby Chaitali Mohile
Duke Energy Corp. has been offering good buying opportunities for all types of traders and investors.
Position: Hold
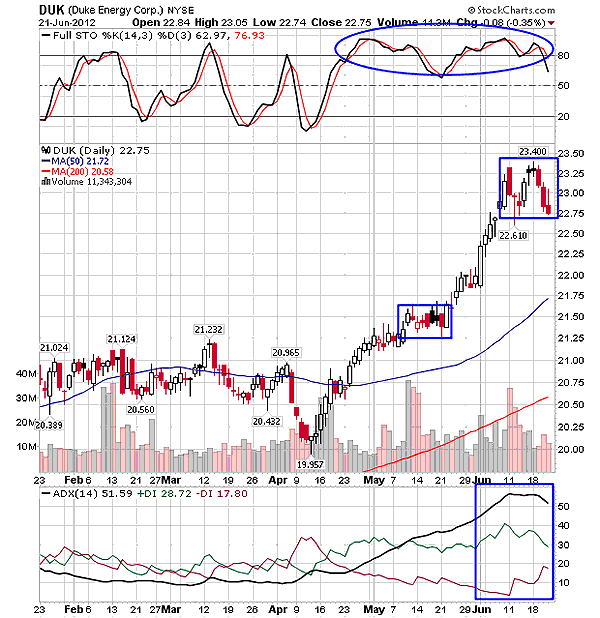
| In the past few years, Duke Energy Corp. (DUK) has been undergoing healthy bullish rallies. On the daily time frame chart (Figure 1), an ascending rally can be seen; it first consolidated in May 2012 within a narrow range. Although the rally was a short one, it witnessed steady bullish pressure. Later, the stock moved sideways between 21.80 and 21.25, forming a bullish flag & pennant continuation pattern. The pattern broke upward and achieved the small target of $23.10 (19.95 - 21.80 = 1.85 + 21.25 = 23.10). We can see that the breakout rally hit the targeted levels and later, consolidated at 23.25 levels. Thus, the stock is very reliable for short-term as well as long-term investors. |
| Currently, the average directional index (ADX) (14) in Figure 1 is highly overheated and ready to plunge. The full stochastic (14,3,3) has been overbought for about two months. Therefore, both oscillators are suggesting a reversal rally for DUK. As a result, the current consolidated move is likely to get more volatile. A descending uptrend would temporarily reduce the buying pressure. However, the uptrend is not likely to reverse. In fact, both declining oscillators are likely to create some room for future upward action. |

|
| FIGURE 1: DUK, DAILY |
| Graphic provided by: StockCharts.com. |
| |
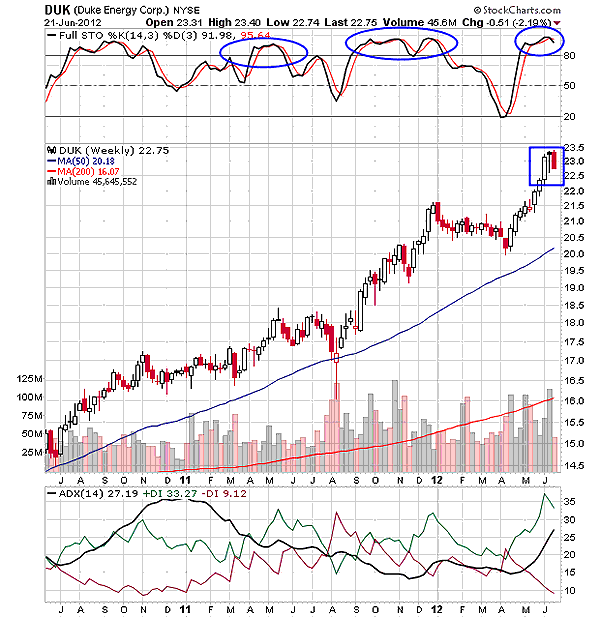
| DUK has steadily rallied to $23.50 in a time span of two and a half years. Although the returns are low, the stock is stable and suitable for low-risk traders. In Figure 2, DUK has moved strongly with the 50-day moving average (MA). Those red bearish candles in the middle of the rally allowed the bulls to rest for a while and helped them gather strength to resume the journey. From April 2011 to April 2012, the trend was weak but the struggling buying and selling pressures pulled the rally higher. We can see in Figure 2 that the buying pressure (green line) of the ADX (14) surged above the selling pressure (red line), thus controlling the upward direction of DUK. The shaky stochastic oscillator established support at the center line, protecting the bullish momentum. Although the 50 levels support was once breached, the price rally did not tumble, instead sustaining the 50-day MA support. Meanwhile, the oscillator turned oversold and resumed its prior bullish move. |

|
| FIGURE 2: DUK, WEEKLY |
| Graphic provided by: StockCharts.com. |
| |
| The moving average can be considered a strong support for DUK. Currently, the stock has formed an evening star candlestick pattern on the top, indicating a trend reversal rally. However, the ADX (14) is not showing any reversal possibilities; the uptrend is developing in Figure 2. Though the stochastic is highly overbought, traders need not worry till it comes close to the 50 levels support. Thus, the bearish reversal candles pattern on the weekly time frame chart in Figure 2 would not damage the bullish sentiment. The candlestick pattern would change the direction of rally by moving sideways till the overbought stochastic cools off. |
| A potential bullish breakout of the current consolidated price rally would open a fresh buying opportunity for traders and investors. DUK would continue to remain in an uptrend. Thus, the stock can be considered by all types of traders. |
Active trader in the Indian stock markets since 2003 and a full-time writer. Trading is largely based upon technical analysis.
| Company: | Independent |
| Address: | C1/3 Parth Indraprasth Towers. Vastrapur |
| Ahmedabad, Guj 380015 | |
| E-mail address: | chaitalimohile@yahoo.co.in |
Traders' Resource Links | |
| Independent has not added any product or service information to TRADERS' RESOURCE. | |
Click here for more information about our publications!
PRINT THIS ARTICLE

Request Information From Our Sponsors
- StockCharts.com, Inc.
- Candle Patterns
- Candlestick Charting Explained
- Intermarket Technical Analysis
- John Murphy on Chart Analysis
- John Murphy's Chart Pattern Recognition
- John Murphy's Market Message
- MurphyExplainsMarketAnalysis-Intermarket Analysis
- MurphyExplainsMarketAnalysis-Visual Analysis
- StockCharts.com
- Technical Analysis of the Financial Markets
- The Visual Investor
- VectorVest, Inc.
- Executive Premier Workshop
- One-Day Options Course
- OptionsPro
- Retirement Income Workshop
- Sure-Fire Trading Systems (VectorVest, Inc.)
- Trading as a Business Workshop
- VectorVest 7 EOD
- VectorVest 7 RealTime/IntraDay
- VectorVest AutoTester
- VectorVest Educational Services
- VectorVest OnLine
- VectorVest Options Analyzer
- VectorVest ProGraphics v6.0
- VectorVest ProTrader 7
- VectorVest RealTime Derby Tool
- VectorVest Simulator
- VectorVest Variator
- VectorVest Watchdog
