HOT TOPICS LIST
- MACD
- Fibonacci
- RSI
- Gann
- ADXR
- Stochastics
- Volume
- Triangles
- Futures
- Cycles
- Volatility
- ZIGZAG
- MESA
- Retracement
- Aroon
INDICATORS LIST
LIST OF TOPICS
PRINT THIS ARTICLE
by Donald W. Pendergast, Jr.
Despite a mild bounce in the broad markets, the gold market issued a new swing sell signal.
Position: N/A
Donald W. Pendergast, Jr.
Donald W. Pendergast is a financial markets consultant who offers specialized services to stock brokers and high net worth individuals who seek a better bottom line for their portfolios.
PRINT THIS ARTICLE
TECHNICAL ANALYSIS
PENDY'S PICKS: June 25, 2012
06/25/12 12:54:15 PMby Donald W. Pendergast, Jr.
Despite a mild bounce in the broad markets, the gold market issued a new swing sell signal.
Position: N/A
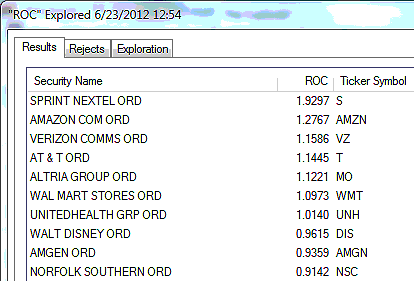
| The .OEX (Standard & Poor's 100) had a minor turn higher on Friday, June 22, but this by no means indicated that the broad markets were on the verge of a meaningful rally anytime soon. However, as nasty as Thursday's decline was, no new RMO (Rahul Mohindar) swing sell signal has yet been issued; the price action this week should be informative as to the broad market's true intentions. Figure 1 is a look at the strongest 13-week relative strength performers in the .OEX. Telecoms (AT&T [T] and Verizon [VZ]) are still strong but losing a bit of comparative momentum against the .OEX; T has also fired an RMO swing sell signal, one that triggers a short entry on a decline beneath $34.99. Sprint (S) has actually continued to strengthen. Amazon (AMZN) and Wal-Mart Stores (WMT) are still ranked high, even though the latter stock has just issued an RMO sell signal, one that will trigger a short entry on a drop below $67.19. |

|
| FIGURE 1: S&P 100 STRONGEST COMPONENTS. The 10 strongest S&P 100 (.OEX) components that have been outperforming the .OEX over the past calendar quarter as of Friday, June 22, 2012. |
| Graphic provided by: AdvancedGET. |
| Graphic provided by: MetaStock Explorer. |
| |
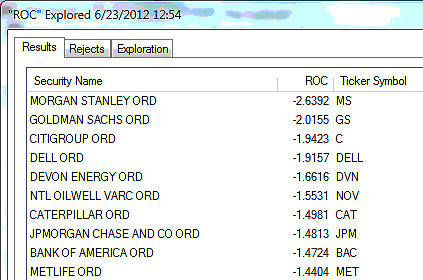
| Figure 2 is a look at the weakest 13-week relative strength performers in the .OEX. Investment banking firms such as JP Morgan Chase (JPM), Goldman Sachs (GS), Citigroup (C), Bank of America (BAC), and Morgan Stanley (MS) are actually increasing their downward momentum, which was already substantial. Although Moody's downgrade of more than a dozen major global banking concerns is hitting shareholders in these issues hard. In the long run, such measures might force the giant banks to clean up their acts, limit discretionary/proprietary trading activities, and become more transparent and accountable to the public and the regulatory authorities. |

|
| FIGURE 2: S&P 100 WEAKEST COMPONENTS. The 10 weakest S&P 100 (.OEX) components that have been underperforming the .OEX over the past calendar quarter as of Friday, June 22, 2012. Investment banking stocks continue to weaken. |
| Graphic provided by: MetaStock. |
| Graphic provided by: MetaStock Explorer. |
| |
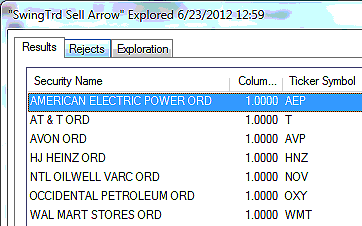
| Figure 3 are the S&P 100 components giving RMO swing sell signals; there were no RMO swing buy signals at all as of Friday's close. A full 7% of the .OEX components issued new RMO swing sell signals on Friday, continuing to bathe the broad markets in a decidedly bearish light. It's not surprising to see a major energy sector issue (Occidental Petroleum [OXY]) fire a new sell signal here; $78.62 triggers a short entry into OXY. With crude oil still below $80 and gasoline continuing to fall (down from $3.94 to $3.21 in just 10 weeks here in Jacksonville, FL), look for continued declines in most integrated oils, oil/gas exploration, and oil services stocks as we move into the heart of the summer. |

|
| FIGURE 3: RMO SWING SELL SIGNALS. The S&P 100 (.OEX) components issuing RMO swing sell signals at the close of trading on Friday, June 22, 2012; 7% of all .OEX components fired sell signals during this session, a sign of continuing weakness in the broad US markets. |
| Graphic provided by: MetaStock. |
| Graphic provided by: MetaStock Explorer. |
| |
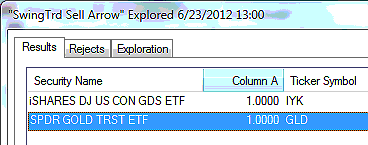
| Figure 4 are the key exchange traded funds (ETFs) from major industry groups or sectors that are flashing new RMO swing sell signals. Note that there were no new RMO swing buy signals on Friday, matching a similar pattern on Thursday -- lots of selling pressure but very lackadaisical buying pressure in the stock and commodities markets. The new sell signal in GLD (SPDRS Gold Trust ETF) is very interesting, not so much because the precious metals are usually weak in the summer months but because it occurs at the same time that the entire commodities complex is under siege once again. While no one knows if the mega-run in commodities that began circa 1999-2001 is finally finished, it is possible that the entire world is now in the grip of a deflationary depression and many of the developed nations could already be mired in "perma-great recessions" similar to those that Japan has endured since their stock and real estate bubbles shattered in 1990. Time will tell, as always. |

|
| FIGURE 4: ETFS. The two ETFs that have fired new RMO swing sell signals as of Friday, June 22, 2012. Gold prices are typically weak in the summer months, but might this be the start of a much greater slide in metals prices? |
| Graphic provided by: MetaStock. |
| Graphic provided by: MetaStock Explorer. |
| |
| The broad US markets are still anticipated to head lower throughout June and part of July 2012, based on multicycle analysis and projections. Until a major multicycle low is made (most likely at lower price levels in the .OEX and .SPX ), it may be wise to: A. Stay out of the market entirely in the relative safety of cash. B. Engage in selective short trading strategies in the weakest relative strength stocks, using the proven mechanical trading strategy of your choice. This daily relative strength-trade signal report will keep you abreast as to the next major buy or sell signal in the .OEX as well as which stocks/ETFs are leading/lagging and/or firing buy or sell signals. |
Donald W. Pendergast is a financial markets consultant who offers specialized services to stock brokers and high net worth individuals who seek a better bottom line for their portfolios.
| Title: | Writer, market consultant |
| Company: | Linear Trading Systems LLC |
| Jacksonville, FL 32217 | |
| Phone # for sales: | 904-239-9564 |
| E-mail address: | lineartradingsys@gmail.com |
Traders' Resource Links | |
| Linear Trading Systems LLC has not added any product or service information to TRADERS' RESOURCE. | |
Click here for more information about our publications!
PRINT THIS ARTICLE

Request Information From Our Sponsors
- StockCharts.com, Inc.
- Candle Patterns
- Candlestick Charting Explained
- Intermarket Technical Analysis
- John Murphy on Chart Analysis
- John Murphy's Chart Pattern Recognition
- John Murphy's Market Message
- MurphyExplainsMarketAnalysis-Intermarket Analysis
- MurphyExplainsMarketAnalysis-Visual Analysis
- StockCharts.com
- Technical Analysis of the Financial Markets
- The Visual Investor
- VectorVest, Inc.
- Executive Premier Workshop
- One-Day Options Course
- OptionsPro
- Retirement Income Workshop
- Sure-Fire Trading Systems (VectorVest, Inc.)
- Trading as a Business Workshop
- VectorVest 7 EOD
- VectorVest 7 RealTime/IntraDay
- VectorVest AutoTester
- VectorVest Educational Services
- VectorVest OnLine
- VectorVest Options Analyzer
- VectorVest ProGraphics v6.0
- VectorVest ProTrader 7
- VectorVest RealTime Derby Tool
- VectorVest Simulator
- VectorVest Variator
- VectorVest Watchdog
