HOT TOPICS LIST
- MACD
- Fibonacci
- RSI
- Gann
- ADXR
- Stochastics
- Volume
- Triangles
- Futures
- Cycles
- Volatility
- ZIGZAG
- MESA
- Retracement
- Aroon
INDICATORS LIST
LIST OF TOPICS
PRINT THIS ARTICLE
by Koos van der Merwe
Is it finally time to buy after a disastrous listing?
Position: Buy
Koos van der Merwe
Has been a technical analyst since 1969, and has worked as a futures and options trader with First Financial Futures in Johannesburg, South Africa.
PRINT THIS ARTICLE
RSI
Buy Facebook After A Disastrous Start?
06/28/12 08:36:51 AMby Koos van der Merwe
Is it finally time to buy after a disastrous listing?
Position: Buy
| We all know what happened to the Facebook (FB) share price with its listing on NASDAQ. However, putting all that aside, is it time to have a good look at the share price and decide whether it is time to buy the share? |

|
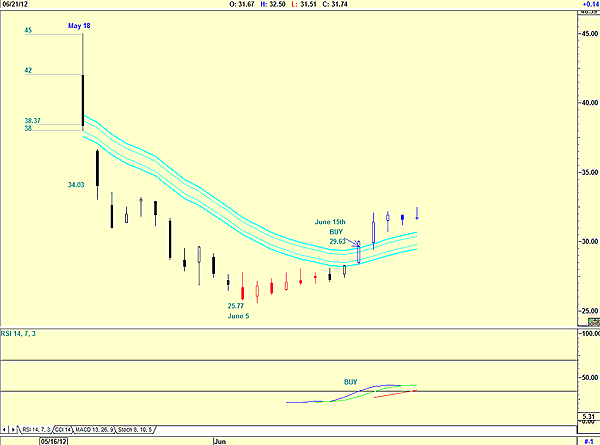
| FIGURE 1: FACEBOOK, DAILY |
| Graphic provided by: AdvancedGET. |
| |
| Figure 1 shows the opening price of Facebook at $42 on May 18 and how the price swiftly rose to $45 and then fell to a low of $38 before closing at $38.37. The low of $38 was supported by Morgan Stanley, but on May 19, the share price dropped to $34.03 and continued falling until it reached a low of $25.77 by June 5. From that level, the share price started recovering, giving a buy signal on the JM internal band indicator on June 15 when the price was $29.63. With the relative strength index (RSI) confirming the buy signal, should we buy FB for a long-term hold? |

|
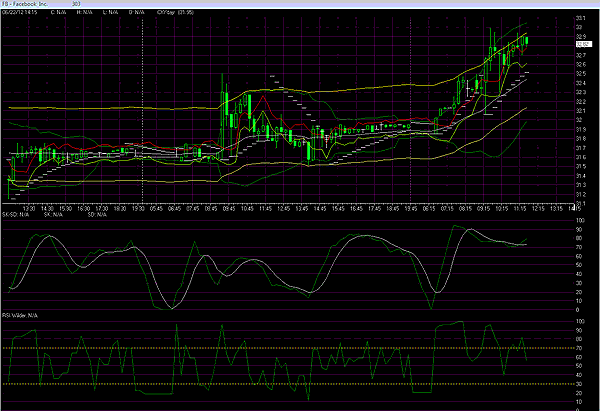
| FIGURE 2: FACEBOOK, 15-MINUTE |
| Graphic provided by: AIQ Systems. |
| |
| Figure 2 is a 15-minute chart and shows how the price supported itself by moving sideways on June 21 when the market dropped strongly. The chart also shows the stock price rising strongly on June 22, opening at $31.90. The indicators on the chart are SK-SD propriety to AIQ Systems, which is showing a buy. However, the RSI is suggesting a sell. The ParaSAR is showing strength, but with the price trading near the upper AIQ band line, a reversal could occur. I would be a buyer of Facebook on any pullback to lower AIQ band level at $32.20 and hold for the long term, until a JM internal band sell signal is given. |
Has been a technical analyst since 1969, and has worked as a futures and options trader with First Financial Futures in Johannesburg, South Africa.
| Address: | 3256 West 24th Ave |
| Vancouver, BC | |
| Phone # for sales: | 6042634214 |
| E-mail address: | petroosp@gmail.com |
Click here for more information about our publications!
Comments

Request Information From Our Sponsors
- StockCharts.com, Inc.
- Candle Patterns
- Candlestick Charting Explained
- Intermarket Technical Analysis
- John Murphy on Chart Analysis
- John Murphy's Chart Pattern Recognition
- John Murphy's Market Message
- MurphyExplainsMarketAnalysis-Intermarket Analysis
- MurphyExplainsMarketAnalysis-Visual Analysis
- StockCharts.com
- Technical Analysis of the Financial Markets
- The Visual Investor
- VectorVest, Inc.
- Executive Premier Workshop
- One-Day Options Course
- OptionsPro
- Retirement Income Workshop
- Sure-Fire Trading Systems (VectorVest, Inc.)
- Trading as a Business Workshop
- VectorVest 7 EOD
- VectorVest 7 RealTime/IntraDay
- VectorVest AutoTester
- VectorVest Educational Services
- VectorVest OnLine
- VectorVest Options Analyzer
- VectorVest ProGraphics v6.0
- VectorVest ProTrader 7
- VectorVest RealTime Derby Tool
- VectorVest Simulator
- VectorVest Variator
- VectorVest Watchdog
