HOT TOPICS LIST
- MACD
- Fibonacci
- RSI
- Gann
- ADXR
- Stochastics
- Volume
- Triangles
- Futures
- Cycles
- Volatility
- ZIGZAG
- MESA
- Retracement
- Aroon
INDICATORS LIST
LIST OF TOPICS
PRINT THIS ARTICLE
by Donald W. Pendergast, Jr.
Thursday, June 21's market plunge may see the S&P 100 plunge into a major multicycle low. The big question now is when.
Position: N/A
Donald W. Pendergast, Jr.
Donald W. Pendergast is a financial markets consultant who offers specialized services to stock brokers and high net worth individuals who seek a better bottom line for their portfolios.
PRINT THIS ARTICLE
REL. STR COMPARATIVE
PENDY'S PICKS: Relative Strength Signals, June 22
06/22/12 09:50:47 AMby Donald W. Pendergast, Jr.
Thursday, June 21's market plunge may see the S&P 100 plunge into a major multicycle low. The big question now is when.
Position: N/A
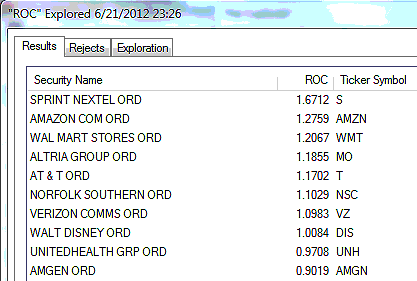
| The .OEX (Standard & Poor's 100) is still technically in a long RMO (Rahul Mohindar) swing buy trade, one that triggered a long entry on a rise above $605.70 on June 9, 2012. The recent reversal may soon trigger a new short RMO swing sell signal, however, given the speed and severity of Thursday's plunge. Figure 1 is a look at the strongest 13-week relative strength performers in the .OEX. Note how strong the telecom group stocks (S, T, and VZ) have been; retailers such as AMZN and WMT have also been doing well. |

|
| FIGURE 1: STRONGEST S&P 100 COMPONENTS. The 10 strongest S&P 100 (.OEX) components that have been outperforming the .OEX over the past calendar quarter as of Thursday, June 21, 2012. |
| Graphic provided by: MetaStock. |
| Graphic provided by: MetaStock Explorer. |
| |
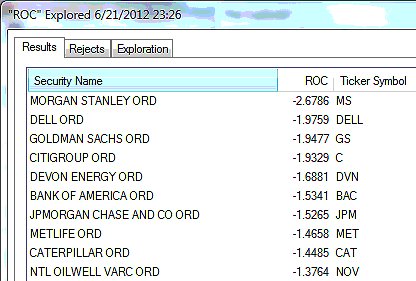
| Figure 2 is a look at the weakest 13-week relative strength performers in the .OEX; investment banking firms such as JP Morgan Chase (JPM), Goldman Sachs (GS), Citigroup (C), Bank of America (BAC), and Morgan Stanley (MS) are certainly leading the way lower, and in a big way. Moody's downgrading of these particular issues may cause further slides in these issues -- or not, given the way that the market is wont to throw a wrench into ordinarily sound logic. |

|
| FIGURE 2: WEAKEST S&P 100 COMPONENTS. The 10 weakest S&P 100 (.OEX) components that have been underperforming the .OEX over the past calendar quarter as of Thursday, June 21, 2012. Note the large number of investment banking stocks that appear here. |
| Graphic provided by: MetaStock. |
| Graphic provided by: MetaStock Explorer. |
| |
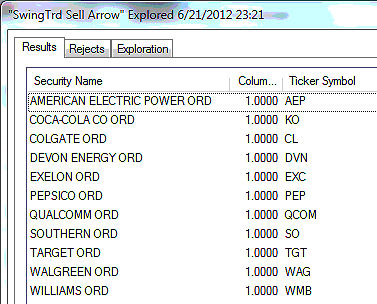
| Figure 3 are the S&P 100 components giving RMO swing sell signals; there were no RMO swing buy signals at all as of Thursday's close. A full 11% of the .OEX components issued new RMO swing sell signals on Thursday, lending a strongly bearish slant to the unfolding market action. The stocks shown here come from a variety of industry groups; even the consumer staples (the "buy or die" sector) companies like Colgate (CL), Coca-Cola (KO), PepsiCo (PEP), and Walgreen's (WAG) are selling off, meaning that there is no real place for investors to hide as the bear takes another swipe at traders and investors. |

|
| FIGURE 3: S&P 100 COMPONENTS ISSUING SWING SELL SIGNALS. The S&P 100 (.OEX) components issuing RMO swing sell signals at the close of trading on Thursday, June 21, 2012; 11% of all .OEX components fired sell signals on the same day, a sign of real weakness in the broad US markets. |
| Graphic provided by: MetaStock. |
| Graphic provided by: MetaStock Explorer. |
| |
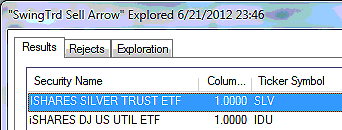
| Figure 4 are the key exchange traded funds (ETFs) from major industry groups or sectors that are flashing new RMO swing sell signals. Note that there were no new RMO swing buy signals on Thursday. The precious metals markets have been in a funk since the April 2011 highs were made. This new sell signal in SLV coming at a time when crude oil has dipped back below $80 could be the harbinger of even greater price pullbacks to come in the commodities markets. |

|
| FIGURE 4: ETFS. The two ETFs that have fired new RMO swing sell signals as of Thursday, June 21, 2012. |
| Graphic provided by: MetaStock. |
| Graphic provided by: MetaStock Explorer. |
| |
| Based on basic multicycle analysis, the S&P 100/500 (.OEX, .SPX) indexes are not due to make a major, multicycle low until sometime around early to mid-July 2012. This may even be delayed, with the next meaningful low in this emerging downtrend not being put in until late July-early August 2012. By all means, traders and investors should already be using either put options to protect long-term holdings or closer trailing stops, if not actually selling out of existing long positions entirely. This daily relative strength-trade signal report will keep you abreast as to the next major sell signal in the .OEX as well as which stocks are leading/lagging and/or firing buy or sell signals. |
Donald W. Pendergast is a financial markets consultant who offers specialized services to stock brokers and high net worth individuals who seek a better bottom line for their portfolios.
| Title: | Writer, market consultant |
| Company: | Linear Trading Systems LLC |
| Jacksonville, FL 32217 | |
| Phone # for sales: | 904-239-9564 |
| E-mail address: | lineartradingsys@gmail.com |
Traders' Resource Links | |
| Linear Trading Systems LLC has not added any product or service information to TRADERS' RESOURCE. | |
Click here for more information about our publications!
Comments

Request Information From Our Sponsors
- StockCharts.com, Inc.
- Candle Patterns
- Candlestick Charting Explained
- Intermarket Technical Analysis
- John Murphy on Chart Analysis
- John Murphy's Chart Pattern Recognition
- John Murphy's Market Message
- MurphyExplainsMarketAnalysis-Intermarket Analysis
- MurphyExplainsMarketAnalysis-Visual Analysis
- StockCharts.com
- Technical Analysis of the Financial Markets
- The Visual Investor
- VectorVest, Inc.
- Executive Premier Workshop
- One-Day Options Course
- OptionsPro
- Retirement Income Workshop
- Sure-Fire Trading Systems (VectorVest, Inc.)
- Trading as a Business Workshop
- VectorVest 7 EOD
- VectorVest 7 RealTime/IntraDay
- VectorVest AutoTester
- VectorVest Educational Services
- VectorVest OnLine
- VectorVest Options Analyzer
- VectorVest ProGraphics v6.0
- VectorVest ProTrader 7
- VectorVest RealTime Derby Tool
- VectorVest Simulator
- VectorVest Variator
- VectorVest Watchdog
