HOT TOPICS LIST
- MACD
- Fibonacci
- RSI
- Gann
- ADXR
- Stochastics
- Volume
- Triangles
- Futures
- Cycles
- Volatility
- ZIGZAG
- MESA
- Retracement
- Aroon
INDICATORS LIST
LIST OF TOPICS
PRINT THIS ARTICLE
by Donald W. Pendergast, Jr.
Knowing how to interpret your system's key summary statistics is of vital importance. Here are a couple of major ones to consider.
Position: N/A
Donald W. Pendergast, Jr.
Donald W. Pendergast is a financial markets consultant who offers specialized services to stock brokers and high net worth individuals who seek a better bottom line for their portfolios.
PRINT THIS ARTICLE
TRADING SYSTEMS
Trading Stats - Be Aware Of Outliers
06/27/12 02:37:51 PMby Donald W. Pendergast, Jr.
Knowing how to interpret your system's key summary statistics is of vital importance. Here are a couple of major ones to consider.
Position: N/A
| Let's say that you've put in hours and hours of work into development and testing of your trading system and as an aspiring developer, you are impressed with the results you're seeing on the charts in both back-and forward-test modes. Congratulations! But have you examined all of your trading stats for the system to make sure that you don't have just a handful of trades contributing the bulk of the system's profits? For example, if your swing trading system for, say, Apple Inc. (AAPL), made $10,000 over the past two years, have you overlooked the fact that maybe it produced one trade that all by itself generated $5,000 of the entire profits attained by the system, and there were 20 or 30 trades total generated by the system? Whenever you have a system that tends to generate overly large individual winners or losers (technically known as "outliers"), you need to ask yourself these questions: 1. Have I used a sufficiently large dataset to generate the trades, preferably at least 100 to 200 trades (if not more) that cover an entire range of market conditions? 2. Has the market that I developed the system on been in an abnormally long bullish or bearish trend, the kind that is normally seen once a decade or even once in a generation? 3. Assuming I have at least 100 to 200 trades in my backtest, are positive trade outliers balanced by a similar amount of negative trade outliers? If your answers to these three critical questions is: 1. No 2. Yes 3. No Then you really have a system that is of dubious quality, one almost surely destined to take a nasty bite out of your account equity once you start trading it. Here's a look at the outlier stats produced by the rustler emini swing trading system, along with a basic explanation as to why they are so important. |

|
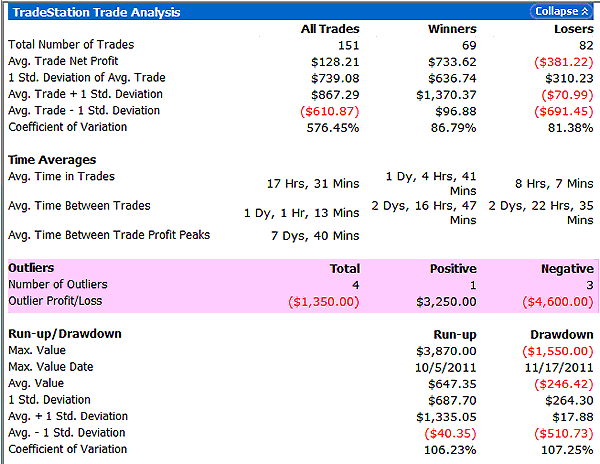
| FIGURE 1: TRADE ANALYSIS. When developing your system, always verify the number of outlier trades, their dollar value in relation to the net profits earned by the system, and the number of positive and negative outliers -- and the net outlier dollar value. |
| Graphic provided by: TradeStation. |
| |
| The rustler system trades the emini Russell 2000 futures from the long side only; these particular backtest-run stats were generated over a nine-month timespan, in which more than 150 trades occurred. This means we have a large-enough sample size to work with, one that should have reasonably reliable statistical value. Now, note the outliers heading; the system produced on positive outlier trade (meaning that its profit was more than three standard deviations larger than the average profitable trade), coming in at $3,250 -- not bad for a single-contract long trade, by the way. But we also see that the system also generated three negative outlier trades for a total of ($4,600). Four outliers in a sample size of 151 trades might be a tad more than some developers like to see, but as long as the dollar amounts of the outlier winners and losers are reasonably balanced, there shouldn't be too much cause for concern, especially since the rustler is based on a trend-following logic where large winning trades are the primary means of generating consistent profits over time. Obviously, the three large losing trade outliers might be of concern to a trader with an exceptionally small ($7,000 to perhaps $10,000 futures margin account), especially since the system frequently carries a position overnight, exposing such positions to occasionally larger than normal dollar value losses. However, for those who understand statistics and probabilities, such infrequent setbacks are best seen as simply part of the invariably challenging one-step-forward, one-step-backward process on the pathway of successful trading and investing. |

|
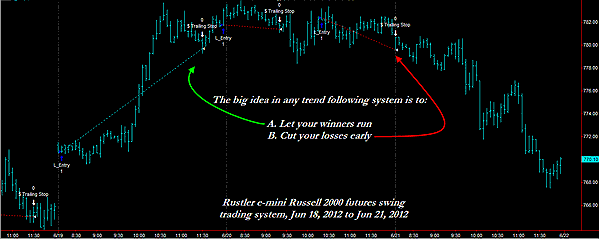
| FIGURE 2: TF. A trend-following system can and does make money, but only if they let winning trades run and cut losing trades early. Using a well-thought-out trading logic and testing process will greatly enhance the chances of developing a system that can make money in the real world of trading. |
| Graphic provided by: TradeStation. |
| |
| A budding developer can drive themselves crazy trying to decipher all of the performance summary stats in TradeStation. While all of them can provide valuable insights as to the validity and tradeworthiness of a given system, you only need to focus on about a dozen (give or take a few) key stats, which will illuminate your understanding about what's really going on inside your latest and greatest trading system achievement. Knowing how many outliers you have and how large they are will give you valuable insight right at the start of the development process and can help you abandon a poorly selected trading logic and/or input and parameters right out the gate, thus saving you valuable time and trading capital in the long run. |
Donald W. Pendergast is a financial markets consultant who offers specialized services to stock brokers and high net worth individuals who seek a better bottom line for their portfolios.
| Title: | Writer, market consultant |
| Company: | Linear Trading Systems LLC |
| Jacksonville, FL 32217 | |
| Phone # for sales: | 904-239-9564 |
| E-mail address: | lineartradingsys@gmail.com |
Traders' Resource Links | |
| Linear Trading Systems LLC has not added any product or service information to TRADERS' RESOURCE. | |
Click here for more information about our publications!
PRINT THIS ARTICLE

Request Information From Our Sponsors
- VectorVest, Inc.
- Executive Premier Workshop
- One-Day Options Course
- OptionsPro
- Retirement Income Workshop
- Sure-Fire Trading Systems (VectorVest, Inc.)
- Trading as a Business Workshop
- VectorVest 7 EOD
- VectorVest 7 RealTime/IntraDay
- VectorVest AutoTester
- VectorVest Educational Services
- VectorVest OnLine
- VectorVest Options Analyzer
- VectorVest ProGraphics v6.0
- VectorVest ProTrader 7
- VectorVest RealTime Derby Tool
- VectorVest Simulator
- VectorVest Variator
- VectorVest Watchdog
- StockCharts.com, Inc.
- Candle Patterns
- Candlestick Charting Explained
- Intermarket Technical Analysis
- John Murphy on Chart Analysis
- John Murphy's Chart Pattern Recognition
- John Murphy's Market Message
- MurphyExplainsMarketAnalysis-Intermarket Analysis
- MurphyExplainsMarketAnalysis-Visual Analysis
- StockCharts.com
- Technical Analysis of the Financial Markets
- The Visual Investor
