HOT TOPICS LIST
- MACD
- Fibonacci
- RSI
- Gann
- ADXR
- Stochastics
- Volume
- Triangles
- Futures
- Cycles
- Volatility
- ZIGZAG
- MESA
- Retracement
- Aroon
INDICATORS LIST
LIST OF TOPICS
PRINT THIS ARTICLE
by Chaitali Mohile
The bearish signals on the technical charts of Medicis Pharma Corp. suggest a strong breakdown.
Position: Sell
Chaitali Mohile
Active trader in the Indian stock markets since 2003 and a full-time writer. Trading is largely based upon technical analysis.
PRINT THIS ARTICLE
BREAKOUTS
MRX Has More Downside
06/27/12 02:03:32 PMby Chaitali Mohile
The bearish signals on the technical charts of Medicis Pharma Corp. suggest a strong breakdown.
Position: Sell
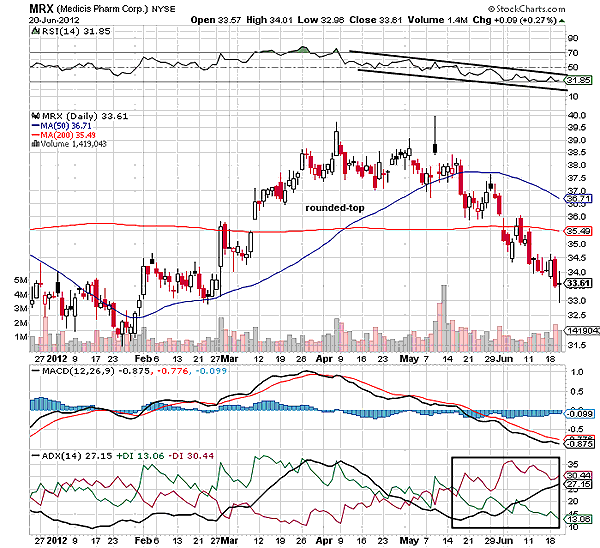
| In early March 2012, Medicis Pharma Corp. (MRX) breached the 200-day moving average (MA) resistance and tried to surge higher. But the rally lacked bullish strength, and as a result, MRX began a reversal journey, forming an inverted cup or a rounded-top pattern. We can see in Figure 1 that the relative strength index (RSI)(14) failed to surge above 70 levels, indicating the lack of bullish strength. The oscillator also formed the rounded top, signifying a strong bearish signal. The moving average convergence/divergence (MACD) (12,26,9) slipped below the trigger line, showing a bearish crossover in positive territory. Although an uptrend developed, the weak bullish pressure and the diminishing momentum discontinued the bullish rally of MRX and formed the rounded top seen in Figure 1. |

|
| FIGURE 1: MRX, DAILY |
| Graphic provided by: StockCharts.com. |
| |
| A bearish breakout is confirmed once the pattern slips below the moving average support. After the bearish breakout, the pattern initiates a fresh descending rally and develops a new downtrend. In Figure 1, the 50-day moving average (MA) support was violated during the construction of the pattern. Later, as the rounded top was completed, the stock broke downward by converting the 200-day moving average (MA) support into resistance. The breakout occurred at 35.49 levels. The average directional index (ADX) (14) developed a new downtrend. |
| At present, all the indicators as seen in Figure 1 are bearish, showing no signs of regaining a bullish journey. Therefore, we can anticipate more downside for MRX. |
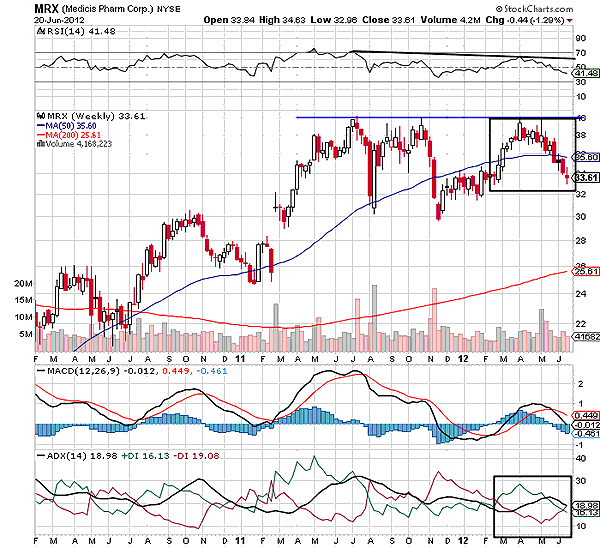
| According to the weekly time frame chart in Figure 2, 40 was the tough resistance for the stock. After hitting the resistance at this level, the stock plunged below the 50-day MA support. Though it recovered immediately, the stock could not break its resistance level. The rounded top was formed by MRX during the third attempt of breaching resistance. Since the three peaks formed near the 40 level and the valley between them is not accurate, we cannot say that a triple top -- a major bearish reversal pattern -- was formed by MRX. The RSI (14) showed negative divergence, suggesting the possibility of downside price action. In addition, the trend was unstable due to a constant struggle between buying and selling pressure. |

|
| FIGURE 2: MRX, WEEKLY |
| Graphic provided by: StockCharts.com. |
| |
| Eventually, the stock underwent the bearish breakout of the rounded-top pattern. MRX broke the 50-day MA support downward and initiated the fresh bearish rally in Figure 2. The breakout target for MRX would be the support area at 30 levels. Thereafter, traders need to stay watchful to analyze the future direction of the stock. This stock would be suitable for short-term traders only as the target is very short. However, if the bearish clouds continue to hover over the declining rally, traders can shift the stop-loss to 30 levels for securing profits, and later, continue their short positions. The current volatile situation would help traders enjoy the bearish ride in MRX. Thus, MRX is a good stock to be considered for short positions. |
Active trader in the Indian stock markets since 2003 and a full-time writer. Trading is largely based upon technical analysis.
| Company: | Independent |
| Address: | C1/3 Parth Indraprasth Towers. Vastrapur |
| Ahmedabad, Guj 380015 | |
| E-mail address: | chaitalimohile@yahoo.co.in |
Traders' Resource Links | |
| Independent has not added any product or service information to TRADERS' RESOURCE. | |
Click here for more information about our publications!
PRINT THIS ARTICLE

Request Information From Our Sponsors
- StockCharts.com, Inc.
- Candle Patterns
- Candlestick Charting Explained
- Intermarket Technical Analysis
- John Murphy on Chart Analysis
- John Murphy's Chart Pattern Recognition
- John Murphy's Market Message
- MurphyExplainsMarketAnalysis-Intermarket Analysis
- MurphyExplainsMarketAnalysis-Visual Analysis
- StockCharts.com
- Technical Analysis of the Financial Markets
- The Visual Investor
- VectorVest, Inc.
- Executive Premier Workshop
- One-Day Options Course
- OptionsPro
- Retirement Income Workshop
- Sure-Fire Trading Systems (VectorVest, Inc.)
- Trading as a Business Workshop
- VectorVest 7 EOD
- VectorVest 7 RealTime/IntraDay
- VectorVest AutoTester
- VectorVest Educational Services
- VectorVest OnLine
- VectorVest Options Analyzer
- VectorVest ProGraphics v6.0
- VectorVest ProTrader 7
- VectorVest RealTime Derby Tool
- VectorVest Simulator
- VectorVest Variator
- VectorVest Watchdog
