HOT TOPICS LIST
- MACD
- Fibonacci
- RSI
- Gann
- ADXR
- Stochastics
- Volume
- Triangles
- Futures
- Cycles
- Volatility
- ZIGZAG
- MESA
- Retracement
- Aroon
INDICATORS LIST
LIST OF TOPICS
PRINT THIS ARTICLE
by James Kupfer
Fibonacci time zone charts are an underutilized tool that can forecast potential turning points.
Position: Hold
James Kupfer
Mr. Kupfer is a market professional and amateur stock market commentator. Disclosure: It is likely that Mr. Kupfer has or will enter a position in any security he writes about.
PRINT THIS ARTICLE
FIBONACCI
Using Fibonacci Time Zones
06/26/12 12:13:31 PMby James Kupfer
Fibonacci time zone charts are an underutilized tool that can forecast potential turning points.
Position: Hold
| If you have been a trader in the market for any length of time, you probably have had some familiarity with Fibonacci numbers and their use in market timing. The use of Fibonacci fans and retracement levels is fairly commonplace, and for that reason I won't rehash the basics here. |
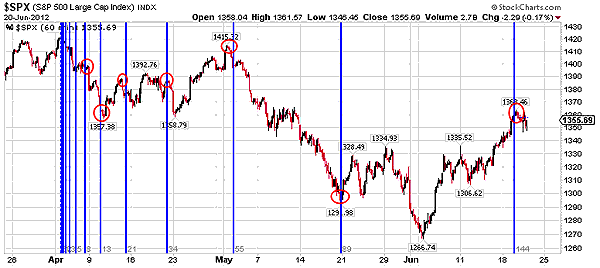
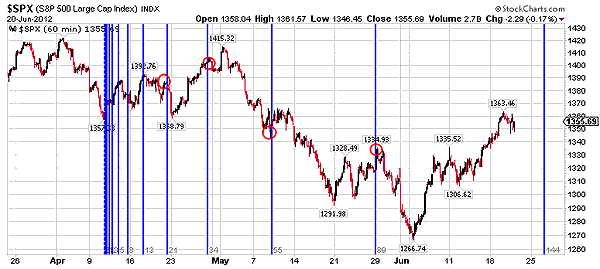
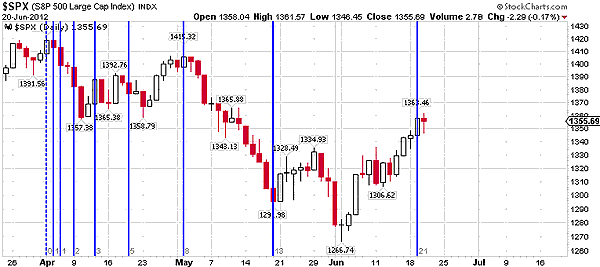
| Fibonacci time zones, however, are not necessarily a tool that all traders are familiar with. As with standard retracement levels and other Fibonacci-based analysis, Fibonacci time zone (FTZ) charts are based on standard Fibonacci ratios, and expect that rather than dealing with price levels, they are used to forecast potential turning points based on time. FTZs are drawn starting at a significant turning point in the market; many charting packages will be able to draw these for you. See Figures 1, 2, and 3. |

|
| FIGURE 1: SPX, 60-MINUTE. Turning points are shown with red circles. |
| Graphic provided by: StockCharts.com. |
| |
| For example, looking at the 60-minute chart, we can see that a FTZ drawn from the SPX's market high in early April accurately predicted a number of important turning points. |

|
| FIGURE 2: SPX, 60-MINUTE. The FTZ is indicating that a significant market turn will occur on or about 13:00 ET on June 26. |
| Graphic provided by: StockCharts.com. |
| |
| It is important to note that like any other tool, FTZs are not necessarily 100% exact. Rather, they are useful to identify zones of time where a turn is likely. FTZs can be used on any time scale, be it intraday charts or annual ones. Finally, as a matter of course, my preference is not to use FTZs of less than 13 periods in the future. |

|
| FIGURE 3: SPX, DAILY. Is the market going to turn down now? |
| Graphic provided by: StockCharts.com. |
| |
| This FTZ based on a daily chart also has identified significant turning junctures. It remains to be seen if the market will turn with this latest FTZ from June 19. |
Mr. Kupfer is a market professional and amateur stock market commentator. Disclosure: It is likely that Mr. Kupfer has or will enter a position in any security he writes about.
Click here for more information about our publications!
Comments

|

Request Information From Our Sponsors
- StockCharts.com, Inc.
- Candle Patterns
- Candlestick Charting Explained
- Intermarket Technical Analysis
- John Murphy on Chart Analysis
- John Murphy's Chart Pattern Recognition
- John Murphy's Market Message
- MurphyExplainsMarketAnalysis-Intermarket Analysis
- MurphyExplainsMarketAnalysis-Visual Analysis
- StockCharts.com
- Technical Analysis of the Financial Markets
- The Visual Investor
- VectorVest, Inc.
- Executive Premier Workshop
- One-Day Options Course
- OptionsPro
- Retirement Income Workshop
- Sure-Fire Trading Systems (VectorVest, Inc.)
- Trading as a Business Workshop
- VectorVest 7 EOD
- VectorVest 7 RealTime/IntraDay
- VectorVest AutoTester
- VectorVest Educational Services
- VectorVest OnLine
- VectorVest Options Analyzer
- VectorVest ProGraphics v6.0
- VectorVest ProTrader 7
- VectorVest RealTime Derby Tool
- VectorVest Simulator
- VectorVest Variator
- VectorVest Watchdog
