HOT TOPICS LIST
- MACD
- Fibonacci
- RSI
- Gann
- ADXR
- Stochastics
- Volume
- Triangles
- Futures
- Cycles
- Volatility
- ZIGZAG
- MESA
- Retracement
- Aroon
INDICATORS LIST
LIST OF TOPICS
PRINT THIS ARTICLE
by Mike Carr, CMT
Relative strength and the concepts behind this strategy offer insights into how to spot potentially big winners.
Position: Buy
Mike Carr, CMT
Mike Carr, CMT, is a member of the Market Technicians Association, and editor of the MTA's newsletter, Technically Speaking. He is also the author of "Smarter Investing in Any Economy: The Definitive Guide to Relative Strength Investing," and "Conquering the Divide: How to Use Economic Indicators to Catch Stock Market Trends."
PRINT THIS ARTICLE
RSI
Spotting Turns In Long-Term Trends
06/26/12 12:10:39 PMby Mike Carr, CMT
Relative strength and the concepts behind this strategy offer insights into how to spot potentially big winners.
Position: Buy
| Relative strength (RS) trading strategies are well known, and many traders apply some idea associated with RS to their trading. "Investor's Business Daily" popularized the RS ranking for stocks, and many traders buy a stock only if that rank is above 80. Value Line also offers a measure of RS with its timeliness rank, and there are a number of studies that demonstrate these ideas work well. In fact, RS is recognized in the academic community as an exception to the efficient market hypothesis. Those studies have confirmed that strong price momentum over periods from three months to more than a year have been a reliable indicator of future performance, which means that buying strong stocks increases your odds of success. But the outperformance only lasts for a time. Other studies show that over the long term (meaning periods of three to five years), stock prices show a mean-reverting behavior. |
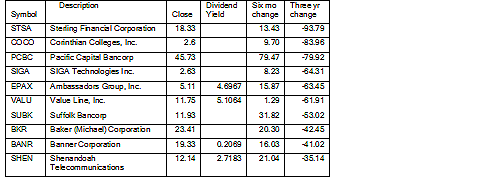
| Mean reversion can be seen with moving averages. Price moves above and below the average, which is the mean. Whenever prices move too far from that mean, they seem to revert to it. Over three- to five-year time periods, studies have shown that stock returns follow this pattern, and the biggest winners of the past three years, for example, would be expected to underperform over the next three. Likewise, long-term losers that survive over three years tend to be among the best performers over the next three. These are tendencies, but they can provide the basis for a trading watchlist. Big losers over the past three years would provide the list of potential trading candidates, and high RS in the short term could provide the trading buy signal. Relative strength is calculated in a number of different ways, but the simplest way might just be to take the rate of change over a certain time frame. In this case, the three-year and six-month rate of change could work. We want a short list of stocks with steep declines over the past three years, and positive price changes over the past six months. More refined calculations can be made, but that is not necessary. Rate of change (ROC) is the basis of the list shown in Figure 1. |

|
| FIGURE 1: RUSSELL 3000. This list is generated from the stocks in the Russell 3000, sorted by the percent change in price over three years. |
| Graphic provided by: Trade Navigator. |
| |
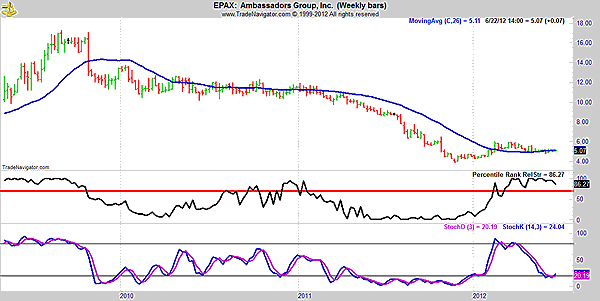
| Once a list is created, chart analysis can be used to provide a trading decision. While any of these stocks could be considered long-term buys with this approach, Figure 2 shows that EPAX has a bullish chart. Its relative strength is high on the weekly chart, and stochastics are oversold but now bullish. |

|
| FIGURE 2: EPAX, WEEKLY. EPAX is showing strength after a big drop over the past three years. |
| Graphic provided by: Trade Navigator. |
| |
| This simple approach combines the principles of relative strength and long-term mean reversion. Recent studies have demonstrated that it is a market-beating long-term strategy, and it is one that traders should consider. Selling could be based on indicators on a weekly chart or moving averages. |
Mike Carr, CMT, is a member of the Market Technicians Association, and editor of the MTA's newsletter, Technically Speaking. He is also the author of "Smarter Investing in Any Economy: The Definitive Guide to Relative Strength Investing," and "Conquering the Divide: How to Use Economic Indicators to Catch Stock Market Trends."
| Website: | www.moneynews.com/blogs/MichaelCarr/id-73 |
| E-mail address: | marketstrategist@gmail.com |
Click here for more information about our publications!
Comments

Request Information From Our Sponsors
- StockCharts.com, Inc.
- Candle Patterns
- Candlestick Charting Explained
- Intermarket Technical Analysis
- John Murphy on Chart Analysis
- John Murphy's Chart Pattern Recognition
- John Murphy's Market Message
- MurphyExplainsMarketAnalysis-Intermarket Analysis
- MurphyExplainsMarketAnalysis-Visual Analysis
- StockCharts.com
- Technical Analysis of the Financial Markets
- The Visual Investor
- VectorVest, Inc.
- Executive Premier Workshop
- One-Day Options Course
- OptionsPro
- Retirement Income Workshop
- Sure-Fire Trading Systems (VectorVest, Inc.)
- Trading as a Business Workshop
- VectorVest 7 EOD
- VectorVest 7 RealTime/IntraDay
- VectorVest AutoTester
- VectorVest Educational Services
- VectorVest OnLine
- VectorVest Options Analyzer
- VectorVest ProGraphics v6.0
- VectorVest ProTrader 7
- VectorVest RealTime Derby Tool
- VectorVest Simulator
- VectorVest Variator
- VectorVest Watchdog
