HOT TOPICS LIST
- MACD
- Fibonacci
- RSI
- Gann
- ADXR
- Stochastics
- Volume
- Triangles
- Futures
- Cycles
- Volatility
- ZIGZAG
- MESA
- Retracement
- Aroon
INDICATORS LIST
LIST OF TOPICS
PRINT THIS ARTICLE
by Matt Blackman
Most would agree that the Facebook IPO was nothing short of a disaster, especially for those who bought shares right at the beginning. But if the pattern taking shape is any indication, those who waited to buy in early June could be in for a handsome reward.
Position: N/A
Matt Blackman
Matt Blackman is a full-time technical and financial writer and trader. He produces corporate and financial newsletters, and assists clients in getting published in the mainstream media. He is the host of TradeSystemGuru.com. Matt has earned the Chartered Market Technician (CMT) designation. Find out what stocks and futures Matt is watching on Twitter at www.twitter.com/RatioTrade
PRINT THIS ARTICLE
CUP WITH HANDLE
Is Facebook On The Comeback Trail?
06/25/12 09:01:26 AMby Matt Blackman
Most would agree that the Facebook IPO was nothing short of a disaster, especially for those who bought shares right at the beginning. But if the pattern taking shape is any indication, those who waited to buy in early June could be in for a handsome reward.
Position: N/A
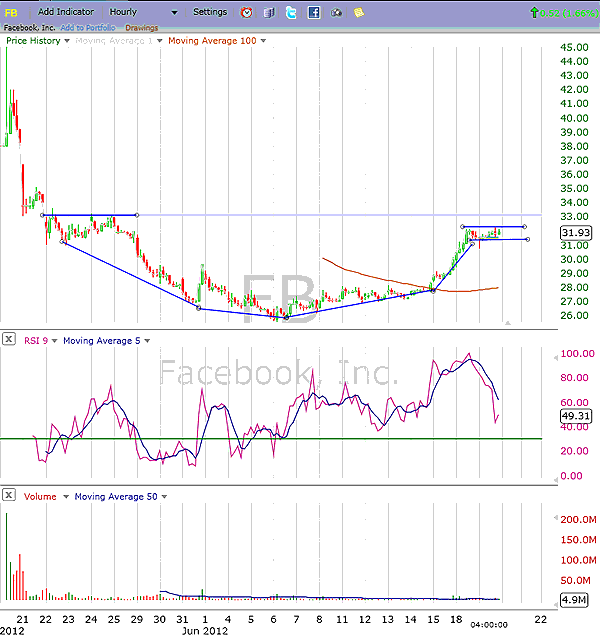
| When the Facebook initial public offering came out on May 18, the media frenzy was incredible. But as the first day wound down, so did the price of the stock. By early June, it had dropped from its initial price of $38 into the $27 range, a loss to those "lucky" enough to get in on the deal of nearly 30%. But since then, the market has been kinder to this social media darling, and by June 19, the stock was trading back around $32. As Figure 1 shows, Facebook is flashing a familiar pattern to active traders -- the cup & handle pattern -- which in this case has the potential to be the bottom in its very short market history. |

|
| FIGURE 1: FB, 60-MINUTE. The FB hourly chart showing a rounding bottom-like chart pattern but with the definite handle on the right-hand side. Volume throughout the pattern has been low, as occurs during consolidations. |
| Graphic provided by: FreeStockCharts.com. |
| |
| According to Suri Duddella, author of "Trade Chart Patterns Like A Pro," the cup & handle is a continuation pattern that identifies bull markets. Trading them is a two-step process. First, the handle can be traded and second, the continuation of the trend offers a further trading opportunity after a breakout from the top of the cup. Since this pattern is clearly not a continuation but rather a reversal pattern, it is rarer. |

|
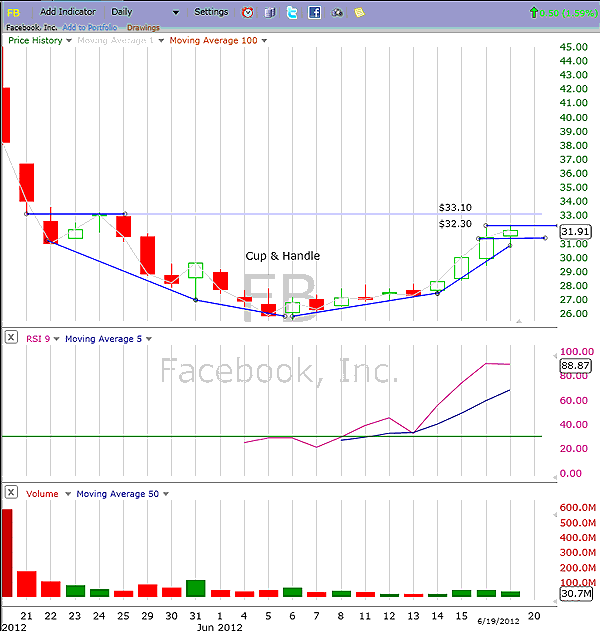
| FIGURE 2: FB, DAILY. Daily chart of FB showing the cup & handle pattern on modest volume. |
| Graphic provided by: FreeStockCharts.com. |
| |
| From a technical standpoint, this pattern is typical of a bottoming process. As selling is exhausted at the left-hand side of the chart, it is slowly being replaced with bottom-pickers who accumulate shares without driving the price significantly higher. This demonstrates the slow change of hands from sellers to buyers, which indicates the smart money is using quiet periods in the market to pick up shares. Volume remains relatively low throughout the process but expect to see spikes on buying volume as technical resistance levels are broken. |
| The first buy point on this pattern will be when the top horizontal line of the handle is broken above $32.30 on increasing volume. Next is the $33.10 resistance line, which also marks the top of the cup (see Figure 2). |
| It is tempting to jump in with two feet on this pattern since it is so pretty, but caution is advised. Patterns like this one can also be traps used by short-sellers to trap unwary bulls. The first test will come at the handle breakout. If it occurs on rising volume, $32.30 should be broken decisively and form support. All bets are off if it is broken in the next few days, especially on strong selling volume. Next, the cup breakout should occur at $33.10, which should also be broken decisively on rising buying volume and, once broken to the upside, should form strong support. |
Matt Blackman is a full-time technical and financial writer and trader. He produces corporate and financial newsletters, and assists clients in getting published in the mainstream media. He is the host of TradeSystemGuru.com. Matt has earned the Chartered Market Technician (CMT) designation. Find out what stocks and futures Matt is watching on Twitter at www.twitter.com/RatioTrade
| Company: | TradeSystemGuru.com |
| Address: | Box 2589 |
| Garibaldi Highlands, BC Canada | |
| Phone # for sales: | 604-898-9069 |
| Fax: | 604-898-9069 |
| Website: | www.tradesystemguru.com |
| E-mail address: | indextradermb@gmail.com |
Traders' Resource Links | |
| TradeSystemGuru.com has not added any product or service information to TRADERS' RESOURCE. | |
Click here for more information about our publications!
PRINT THIS ARTICLE

Request Information From Our Sponsors
- StockCharts.com, Inc.
- Candle Patterns
- Candlestick Charting Explained
- Intermarket Technical Analysis
- John Murphy on Chart Analysis
- John Murphy's Chart Pattern Recognition
- John Murphy's Market Message
- MurphyExplainsMarketAnalysis-Intermarket Analysis
- MurphyExplainsMarketAnalysis-Visual Analysis
- StockCharts.com
- Technical Analysis of the Financial Markets
- The Visual Investor
- VectorVest, Inc.
- Executive Premier Workshop
- One-Day Options Course
- OptionsPro
- Retirement Income Workshop
- Sure-Fire Trading Systems (VectorVest, Inc.)
- Trading as a Business Workshop
- VectorVest 7 EOD
- VectorVest 7 RealTime/IntraDay
- VectorVest AutoTester
- VectorVest Educational Services
- VectorVest OnLine
- VectorVest Options Analyzer
- VectorVest ProGraphics v6.0
- VectorVest ProTrader 7
- VectorVest RealTime Derby Tool
- VectorVest Simulator
- VectorVest Variator
- VectorVest Watchdog
