HOT TOPICS LIST
- MACD
- Fibonacci
- RSI
- Gann
- ADXR
- Stochastics
- Volume
- Triangles
- Futures
- Cycles
- Volatility
- ZIGZAG
- MESA
- Retracement
- Aroon
INDICATORS LIST
LIST OF TOPICS
PRINT THIS ARTICLE
by Donald W. Pendergast, Jr.
For trend followers, a key factor in selecting the right system is to find one that will let winners run while cutting losers short.
Position: N/A
Donald W. Pendergast, Jr.
Donald W. Pendergast is a financial markets consultant who offers specialized services to stock brokers and high net worth individuals who seek a better bottom line for their portfolios.
PRINT THIS ARTICLE
TRADING SYSTEMS
Trade Stats - Let Winners Run
06/25/12 12:38:35 PMby Donald W. Pendergast, Jr.
For trend followers, a key factor in selecting the right system is to find one that will let winners run while cutting losers short.
Position: N/A
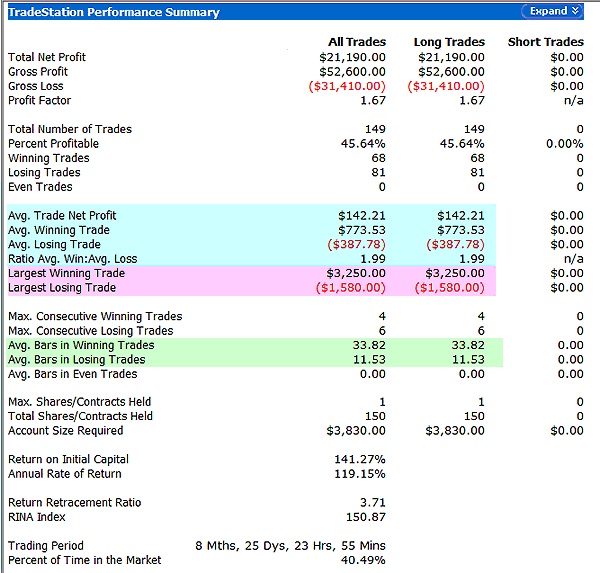
| In this article, we will look at a pair of key statistics that trend followers need to be concerned about -- the average bars in winning trades and average bars in losing trades -- and how to decipher what they're really telling us about our systems. Here's a closer look now, using a long-only, emini Russell 2000 futures swing trading system (Figures 1, 2, and 3). |

|
| FIGURE 1: PERFORMANCE SUMMARY. The average bars in winning trades/average bars in losing trades set of stats should be one of your main points of focus as you set out to build a solid trend-following system. |
| Graphic provided by: TradeStation. |
| |
| The rustler swing trading system uses a five-minute bar and trades the emini Russell 2000 futures contract, relying on a trend-following logic to trigger all trades -- from the long side only. That's right, no short trades are allowed in this system; extensive testing proved the fact that trading the short side of this market simply got in the way of its ability to maximize profits from buying on a long signal, letting the trade run until the final stopout and then staying in the safety of cash until the next long signal appears. One of the first set of stats that I always check during the system development process are the average bars in winning trades and average bars in losing trades. Doing so tells me whether the build is allowing winning trades to carry their weight; after all, the system only produces a winning trade about 45% to 46% of the time (about average for a trend-following method), meaning that the winning trades need to make a lot more profit per trade than the losing trades lose per trade. In this example, the system's long winning trades average 33.82 bars, while its losing trades last for an average of only 11.53 bars -- a nearly 3-to-1 ratio, which is satisfactory and tells me that this system has very little patience when it comes to trade entries that fail to catch a bid and move into the profit zone within a relatively short period of time. It also tells me that the system is patient with the winners, giving them enough room to withstand the back & fill fluctuations that the market loves to send in order to test the psychological endurance of all traders -- and trend followers in particular. As a rule, I've found that the best trend-following systems will allow winning trades to run at least 2.5 to three times as long as they do losing trades, so hopefully this information will help you get a better focus when analyzing your TradeStation (or whatever system development platform you use) performance summary statistics. Of course, you still need to look at the net profitability of the system, the profit factor, drawdown, average profit per trade, and so on, but if you're a trend follower, the sooner you get a good grip on the "let winners run, cut losers short" factor, the sooner you'll find that the rest of the stats will also be presentable (and potentially profitable as well). |

|
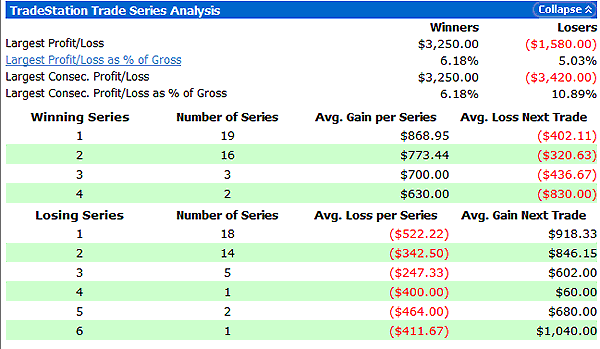
| FIGURE 2: TRADE SERIES ANALYSIS. Knowing how your system will likely react after a string of winning or losing trades can help keep you from getting too overconfident after a long win streak or too depressed after a long drawdown. |
| Graphic provided by: TradeStation. |
| |
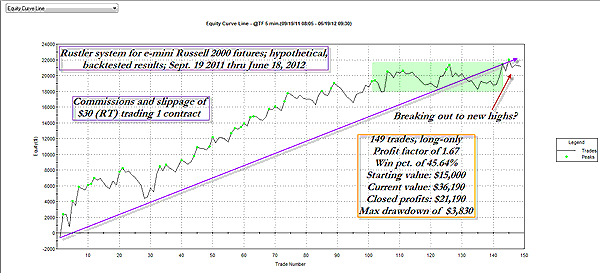
| Taking a glance at a few other stats is also time well-spent. For example, I also tend to focus on the way a system typically behaves after an extended winning or losing streak; after a string of as many as six losses, this system will on average produce a winning trade of $1,040. The system, after a winning streak of as many as four trades, will also generate a losing trade averaging about $830. These are important stats to know, as they can help give you some extra staying power during times of system drawdown even as they can help keep you from getting overconfident toward the tail end of a nice winning streak. Finally, the actual equity curve graph shows that the system isn't too volatile and that it seems to draw down into more of a trading range rather than a large, singular thrust pullback. If the underlying logic of the system is viable and able to adapt in the currently unfolding market scene, then it's not too hard to imagine that its equity curve may soon go on to make new highs. Whether it does or not, you at least have a better understanding of certain trading statistics that have a vital impact on the actual performance of your system. |

|
| FIGURE 3: EMINI RUSSELL 2000. A system in which drawdowns are typically played out as periods of rangebound activity rather than that of sharp, sustained downward thrusts may be appealing to some traders. |
| Graphic provided by: MetaStock. |
| |
Donald W. Pendergast is a financial markets consultant who offers specialized services to stock brokers and high net worth individuals who seek a better bottom line for their portfolios.
| Title: | Writer, market consultant |
| Company: | Linear Trading Systems LLC |
| Jacksonville, FL 32217 | |
| Phone # for sales: | 904-239-9564 |
| E-mail address: | lineartradingsys@gmail.com |
Traders' Resource Links | |
| Linear Trading Systems LLC has not added any product or service information to TRADERS' RESOURCE. | |
Click here for more information about our publications!
PRINT THIS ARTICLE

Request Information From Our Sponsors
- StockCharts.com, Inc.
- Candle Patterns
- Candlestick Charting Explained
- Intermarket Technical Analysis
- John Murphy on Chart Analysis
- John Murphy's Chart Pattern Recognition
- John Murphy's Market Message
- MurphyExplainsMarketAnalysis-Intermarket Analysis
- MurphyExplainsMarketAnalysis-Visual Analysis
- StockCharts.com
- Technical Analysis of the Financial Markets
- The Visual Investor
- VectorVest, Inc.
- Executive Premier Workshop
- One-Day Options Course
- OptionsPro
- Retirement Income Workshop
- Sure-Fire Trading Systems (VectorVest, Inc.)
- Trading as a Business Workshop
- VectorVest 7 EOD
- VectorVest 7 RealTime/IntraDay
- VectorVest AutoTester
- VectorVest Educational Services
- VectorVest OnLine
- VectorVest Options Analyzer
- VectorVest ProGraphics v6.0
- VectorVest ProTrader 7
- VectorVest RealTime Derby Tool
- VectorVest Simulator
- VectorVest Variator
- VectorVest Watchdog
