HOT TOPICS LIST
- MACD
- Fibonacci
- RSI
- Gann
- ADXR
- Stochastics
- Volume
- Triangles
- Futures
- Cycles
- Volatility
- ZIGZAG
- MESA
- Retracement
- Aroon
INDICATORS LIST
LIST OF TOPICS
PRINT THIS ARTICLE
by Gary Grosschadl
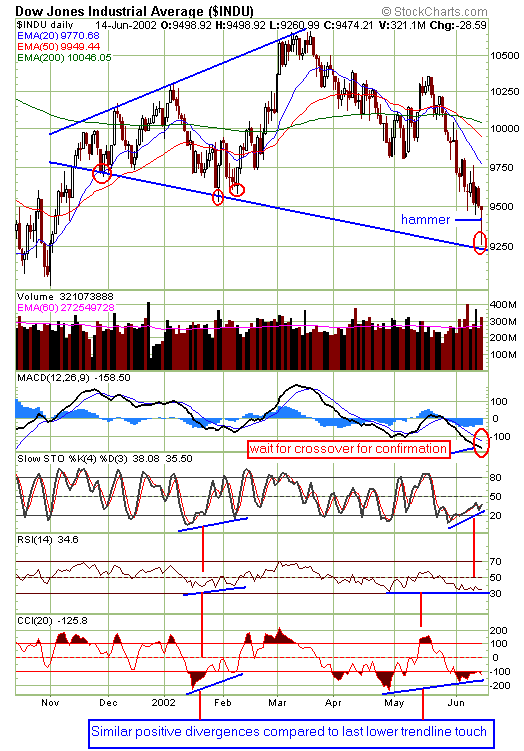
A previously identified broadening pattern is now coming into play and a candlestick pattern hints at short term outcome.
Position: N/A
Gary Grosschadl
Independent Canadian equities trader and technical analyst based in Peterborough
Ontario, Canada.
PRINT THIS ARTICLE
BROADENING FORMATION
Looks Like the Dow is Set for a Possible Rally
06/17/02 08:55:40 AMby Gary Grosschadl
A previously identified broadening pattern is now coming into play and a candlestick pattern hints at short term outcome.
Position: N/A
| In a previous article "The Dow's Bearish Broadening Formations Persist" (05/13/02), I suggested that a trendline test around 9250 might be coming. Friday's extreme price swing had a low of 9261. That combined with a "hammer" candlestick formation indicating a possible bottom, looks convincing enough to satisfy that trendline test. What we need now is a confirming bullish candle or up-day to verify this bullish potential for a noteable rally. The pervasive taste of doom and gloom out in the marketplace may well be an important capitulation marker here. Volume on Friday hit a healthy 321 million shares and it will be interesting to see if enough traders sense a substantial turning point and volume hits higher levels here. |
| As noted on the chart, each trendline touch, or near trendline touch, resulted in a substantial rally and no doubt some traders will try to anticipate a reoccurrence. The downside danger would be failure here and an abrupt move to violate the trendline. I don't think this is as likely, but as always the market will have the final say. |

|
| Graphic provided by: stockcharts.com. |
| |
| Notice what the chart indicators are suggesting at this juncture. There are several positive divergences set up, and observe the similar set up at the previous trendline test. This adds credence to the bullish scenario. With a bullish confirmation here the MACD (moving average convergence/divergence) will soon give us a bullish confirmation via a crossover. Aggressive traders may choose to move with a bullish candle confirmation of Friday's hammer while a more prudent trader may wait for MACD's moving average line crossover. Important upside tests will likely occur at 9750 and 10,000. |
Independent Canadian equities trader and technical analyst based in Peterborough
Ontario, Canada.
| Website: | www.whatsonsale.ca/financial.html |
| E-mail address: | gwg7@sympatico.ca |
Click here for more information about our publications!
Comments
Date: 06/18/02Rank: 5Comment:
Date: 06/18/02Rank: 5Comment: Bingo! You couldn t be more right or shall i say if one is on the right side!!
Your interp. is well grasped by the market at the moment
Well Done
Salil Patankar
Date: 06/18/02Rank: 5Comment:
Date: 06/19/02Rank: 3Comment:
Date: 06/20/02Rank: 5Comment:
Date: 06/21/02Rank: 4Comment:
Date: 06/24/02Rank: 3Comment:

Request Information From Our Sponsors
- VectorVest, Inc.
- Executive Premier Workshop
- One-Day Options Course
- OptionsPro
- Retirement Income Workshop
- Sure-Fire Trading Systems (VectorVest, Inc.)
- Trading as a Business Workshop
- VectorVest 7 EOD
- VectorVest 7 RealTime/IntraDay
- VectorVest AutoTester
- VectorVest Educational Services
- VectorVest OnLine
- VectorVest Options Analyzer
- VectorVest ProGraphics v6.0
- VectorVest ProTrader 7
- VectorVest RealTime Derby Tool
- VectorVest Simulator
- VectorVest Variator
- VectorVest Watchdog
- StockCharts.com, Inc.
- Candle Patterns
- Candlestick Charting Explained
- Intermarket Technical Analysis
- John Murphy on Chart Analysis
- John Murphy's Chart Pattern Recognition
- John Murphy's Market Message
- MurphyExplainsMarketAnalysis-Intermarket Analysis
- MurphyExplainsMarketAnalysis-Visual Analysis
- StockCharts.com
- Technical Analysis of the Financial Markets
- The Visual Investor
