HOT TOPICS LIST
- MACD
- Fibonacci
- RSI
- Gann
- ADXR
- Stochastics
- Volume
- Triangles
- Futures
- Cycles
- Volatility
- ZIGZAG
- MESA
- Retracement
- Aroon
INDICATORS LIST
LIST OF TOPICS
PRINT THIS ARTICLE
by Donald W. Pendergast, Jr.
MetaStock Explorer can help traders locate stocks that are in long-term bullish trends -- on multiple time frames.
Position: N/A
Donald W. Pendergast, Jr.
Donald W. Pendergast is a financial markets consultant who offers specialized services to stock brokers and high net worth individuals who seek a better bottom line for their portfolios.
PRINT THIS ARTICLE
CHART ANALYSIS
Scanning For Long-Term Bullish Stocks
06/22/12 08:46:46 AMby Donald W. Pendergast, Jr.
MetaStock Explorer can help traders locate stocks that are in long-term bullish trends -- on multiple time frames.
Position: N/A
| Do you have a generally effective trading system? Are you interested in learning about a simple screening process that can help you find stocks that have increased in price over the past one, three, six, 12, and 24 months, thus enabling you to trade (from the long side) only those stocks that have a measurably bullish trend already in place? Here's how to do it on an end-of-day (EOD) basis, using large-cap stocks from the Standard & Poor's 100. |

|
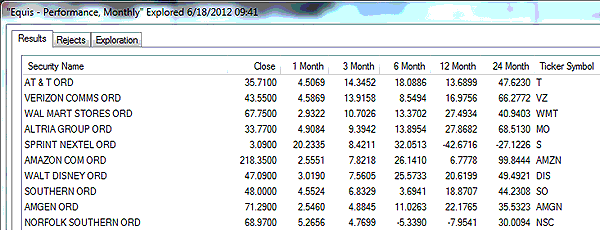
| FIGURE 1: PERFORMANCE, MONTHLY. Exploring for stocks with net gains in mutiple monthly time periods may help simplify your task of locating suitable long trade candidates for your mechanical trading system. |
| Graphic provided by: MetaStock. |
| Graphic provided by: MetaStock Explorer. |
| |
| Using the "Equis Performance, Monthly" exploration (Figure 1), we can load any list of stocks (or futures contracts, indexes, exchange traded funds (ETFs), or mutual funds, for that matter) and quickly discern which ones are outperforming over specific periods of time. Here's how to accomplish this using MetaStock (MS) 11 EOD software, using a list of S&P 100 component stocks. |

|
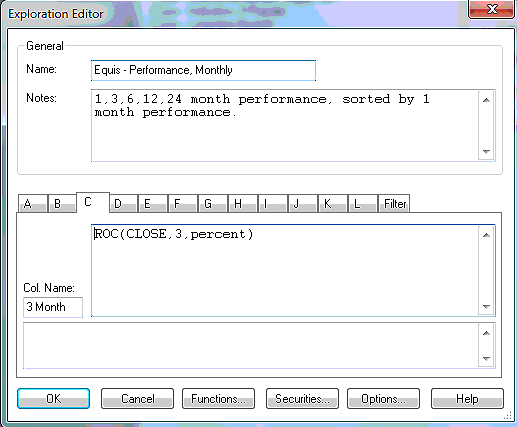
| FIGURE 2: EXPLORATION EDITOR. Here's the MetaStock formula to determine the latest three-month price gains in your favorite list of stocks. |
| Graphic provided by: MetaStock. |
| Graphic provided by: MetaStock Explorer. |
| |
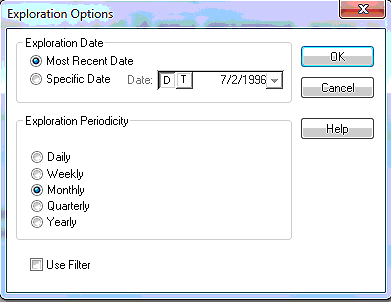
| In MetaStock 11, simply open up the Explorer, load your list of S&P 100 component stocks (or whichever list of stocks you prefer), making sure that the periodicity is set to monthly and that "Most recent date" is checked in the exploration editor options screen (Figure 2). Close the editor and simply start the exploration; it will only take a few seconds for MS 11 to give you the exploration results. In this example, there are a number of large-cap stocks that are showing net price gains in the one-, three-, six-, 12-, and 24-month time periods; these stocks might be interesting to include as part of a daily watchlist that can be regularly monitored for mechanical buy signals in any number of the trading systems and methods that come as standard equipment in MS 11. For this article, I am especially interested to find stocks that have produced net gains over the last three months, as this has been a relatively turbulent market phase, and which are also showing net gains over all of the other monthly time periods as well. Double-clicking on the top of the three-month column heading brings AT&T (T) to the top of the list; the stock has actually posted a gain of better than 14% since mid-March 2012 and is up by 18%+ over the past six months and 47%+ over the past 24 months. For traders/investors who like to only buy stocks that are in existing uptrends, this is truly useful information. Here's a basic checklist you may to go through to actually put all of this information to good use: 1. Make sure you only use liquid, high-volume stocks in your exploration, preferably issues that trade at $5 or more per share. 2. Locate those stocks that show net price gains over all of these monthly time periods, and the higher, the better. 3. Of those stocks, look for those that have favorable earnings growth projections for at least the next two quarters. 4. Once you have a focus list of stocks, your next task is to wait for a mechanical buy signal from one of MS 11's systems; the RMO (Rahul Mohindar) trading system is excellent, as is the Gil Raff MarketSpace Stock system -- these could be great starting points for swing and trend-following traders. Many of the performance systems (PS) in MS 11 are also worth a look; the "PS Long Sell Sell Short Sale-5 Day" system might be of interest to shorter-term traders looking to milk quicker potential profits. Whichever system you settle on, at least you'll be trading steadily uptrending, fundamentally sound stocks that should put the odds of trading success more favorably in your corner as you seek to extract profits from the market on a regular basis. See Figure 3. Limiting your risk per trade to no more than 1% to 2% per trade will further help reduce the potential for damage to your account during those times when you experience a string of losing trades, which is inevitable, yet survivable if you keep your risks on the modest side. |

|
| FIGURE 3: EXPLORATION OPTIONS. Here are the formatting options in the MS 11 exploration editor. |
| Graphic provided by: MetaStock. |
| Graphic provided by: MetaStock Explorer. |
| |
Donald W. Pendergast is a financial markets consultant who offers specialized services to stock brokers and high net worth individuals who seek a better bottom line for their portfolios.
| Title: | Writer, market consultant |
| Company: | Linear Trading Systems LLC |
| Jacksonville, FL 32217 | |
| Phone # for sales: | 904-239-9564 |
| E-mail address: | lineartradingsys@gmail.com |
Traders' Resource Links | |
| Linear Trading Systems LLC has not added any product or service information to TRADERS' RESOURCE. | |
Click here for more information about our publications!
Comments

Request Information From Our Sponsors
- StockCharts.com, Inc.
- Candle Patterns
- Candlestick Charting Explained
- Intermarket Technical Analysis
- John Murphy on Chart Analysis
- John Murphy's Chart Pattern Recognition
- John Murphy's Market Message
- MurphyExplainsMarketAnalysis-Intermarket Analysis
- MurphyExplainsMarketAnalysis-Visual Analysis
- StockCharts.com
- Technical Analysis of the Financial Markets
- The Visual Investor
- VectorVest, Inc.
- Executive Premier Workshop
- One-Day Options Course
- OptionsPro
- Retirement Income Workshop
- Sure-Fire Trading Systems (VectorVest, Inc.)
- Trading as a Business Workshop
- VectorVest 7 EOD
- VectorVest 7 RealTime/IntraDay
- VectorVest AutoTester
- VectorVest Educational Services
- VectorVest OnLine
- VectorVest Options Analyzer
- VectorVest ProGraphics v6.0
- VectorVest ProTrader 7
- VectorVest RealTime Derby Tool
- VectorVest Simulator
- VectorVest Variator
- VectorVest Watchdog
