HOT TOPICS LIST
- MACD
- Fibonacci
- RSI
- Gann
- ADXR
- Stochastics
- Volume
- Triangles
- Futures
- Cycles
- Volatility
- ZIGZAG
- MESA
- Retracement
- Aroon
INDICATORS LIST
LIST OF TOPICS
PRINT THIS ARTICLE
by Koos van der Merwe
What to do when one sees an inverse head & shoulders pattern developing on a weekly chart.
Position: Buy
Koos van der Merwe
Has been a technical analyst since 1969, and has worked as a futures and options trader with First Financial Futures in Johannesburg, South Africa.
PRINT THIS ARTICLE
HEAD & SHOULDERS
Take A Look At Broadcom
06/21/12 01:28:55 PMby Koos van der Merwe
What to do when one sees an inverse head & shoulders pattern developing on a weekly chart.
Position: Buy
| With the tremendous advance in wireless products, and the pressure put on wireless internet suppliers by companies like Netflix and others, innovation is necessary and captures much attention. Broadcom (BRCM) was a company whose share price moved from a low of $8.40 in May 1998 to a high of $183.17 by August 2000, at which point it collapsed back to $7.99 in October 2002 when the technology bubble burst. Since then, it has gradually recovered, trading in a range of $13.32 to $50.29. So is the share worth buying now? |

|
| FIGURE 1: BRCM, WEEKLY |
| Graphic provided by: AdvancedGET. |
| |
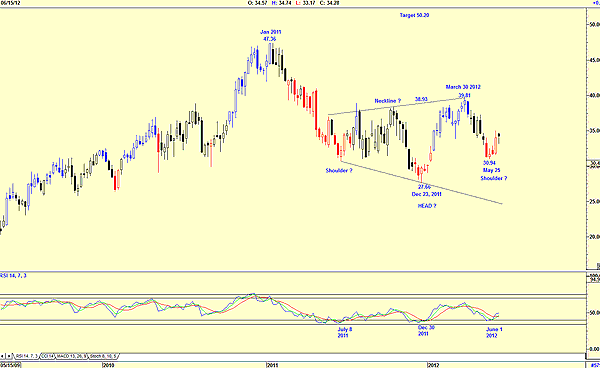
| Figure 1, a weekly chart, shows the price reaching a high of $47.36 by January 2011. It then fell to a low of $27.66 by December 23, 2011, and recovered to $39.81 by March 30, 2012. The share price then fell to $30.94 by May 25, and the pattern resembles a trumpet shape formation, which is a sign of uncertainty, or the possibility of an inverse head & shoulders formation, should the price rise above the neckline at $39.81 with a target of $50.20 (38.93 - 27.66 = 11.27 + 38.93 = 50.20). The relative strength index (RSI) does show that buy signals were given on July 8, 2011, when the price was $432.98 and again on December 30, 2011, and June 1, 2012. The chart also shows that the trend-following XTL indicator, one that changes the color of the candlestick, has changed from red to black, signaling a move from negative to neutral. |

|
| FIGURE 2: BRCM, DAILY |
| Graphic provided by: AdvancedGET. |
| |
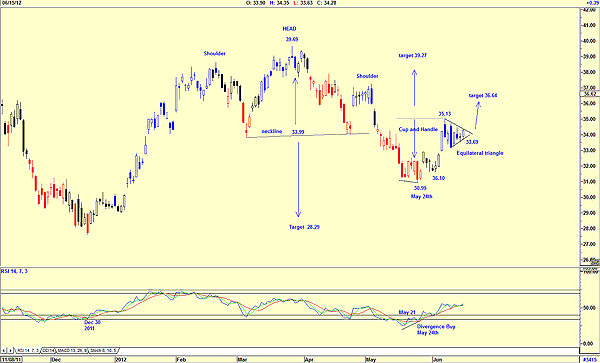
| Figure 2, a daily chart, however shows that a very strong head & shoulders pattern formed, suggesting a target of $28.29. But the share price did not fall to that level, dropping as low as $30.99 by May 24 when the RSI gave a divergence buy signal on May 24. Does this mean that the head & shoulders target is now something of the past? It sure looks like it. The price has since recovered and is now forming an equilateral triangle suggesting an immediate target of $36.64 (36.10 -33.15 = 2.95 + 33.69 = 36.64) once it breaks above the upper triangles trendline, or it could be forming a cup & handle formation, which in turn is suggesting a target of $39.27 (35.13 -30.99 = 4.14 + 35.13 = 39.27). Whatever the final target will be, the chart is suggesting strength. This is a share we could buy at present levels with the possibility of a 10% to 20% gain. |
Has been a technical analyst since 1969, and has worked as a futures and options trader with First Financial Futures in Johannesburg, South Africa.
| Address: | 3256 West 24th Ave |
| Vancouver, BC | |
| Phone # for sales: | 6042634214 |
| E-mail address: | petroosp@gmail.com |
Click here for more information about our publications!
PRINT THIS ARTICLE

|

Request Information From Our Sponsors
- VectorVest, Inc.
- Executive Premier Workshop
- One-Day Options Course
- OptionsPro
- Retirement Income Workshop
- Sure-Fire Trading Systems (VectorVest, Inc.)
- Trading as a Business Workshop
- VectorVest 7 EOD
- VectorVest 7 RealTime/IntraDay
- VectorVest AutoTester
- VectorVest Educational Services
- VectorVest OnLine
- VectorVest Options Analyzer
- VectorVest ProGraphics v6.0
- VectorVest ProTrader 7
- VectorVest RealTime Derby Tool
- VectorVest Simulator
- VectorVest Variator
- VectorVest Watchdog
- StockCharts.com, Inc.
- Candle Patterns
- Candlestick Charting Explained
- Intermarket Technical Analysis
- John Murphy on Chart Analysis
- John Murphy's Chart Pattern Recognition
- John Murphy's Market Message
- MurphyExplainsMarketAnalysis-Intermarket Analysis
- MurphyExplainsMarketAnalysis-Visual Analysis
- StockCharts.com
- Technical Analysis of the Financial Markets
- The Visual Investor
