HOT TOPICS LIST
- MACD
- Fibonacci
- RSI
- Gann
- ADXR
- Stochastics
- Volume
- Triangles
- Futures
- Cycles
- Volatility
- ZIGZAG
- MESA
- Retracement
- Aroon
INDICATORS LIST
LIST OF TOPICS
PRINT THIS ARTICLE
by Donald W. Pendergast, Jr.
Shares of Freeport-McMoran Copper and Gold (FCX) tumbled by nearly 40% between late January and late May 2012, but now appear to be on the rebound again.
Position: N/A
Donald W. Pendergast, Jr.
Donald W. Pendergast is a financial markets consultant who offers specialized services to stock brokers and high net worth individuals who seek a better bottom line for their portfolios.
PRINT THIS ARTICLE
TECHNICAL ANALYSIS
Freeport-McMoran Set To Run Higher?
06/21/12 08:14:33 AMby Donald W. Pendergast, Jr.
Shares of Freeport-McMoran Copper and Gold (FCX) tumbled by nearly 40% between late January and late May 2012, but now appear to be on the rebound again.
Position: N/A
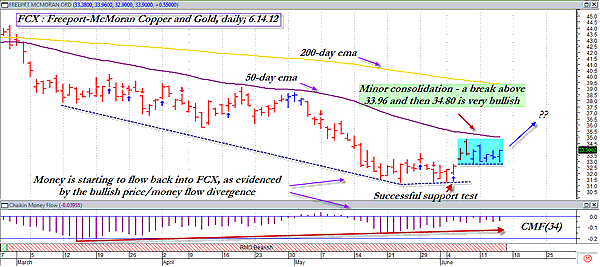
| Large-cap mining stocks are some of the best ones for swing traders and trend followers to focus on, as they rarely stay in one particular price zone on their respective price charts for very long. One of the best trending metals mining stocks is Freeport-McMoran Copper and Gold (FCX), and its daily chart is currently depicting what looks to be a very promising buy setup for swing and/or trend followers. Here's a closer look right now (Figure 1). |

|
| FIGURE 1: FCX, DAILY. Overall, the technical action on FCX's daily chart suggests that the long of least resistance in this large-cap mining stock may be toward higher valuations. |
| Graphic provided by: MetaStock. |
| Graphic provided by: RMO indicators from MetaStock 11. |
| |
| When FCX starts to move, it sometimes does it in a big way -- either higher or lower, and, as the daily chart confirms, its last major trend move was down by nearly 40% in a four-month period. And while that kind of a bearish decline might be extraordinary for a sluggish utility stock, experienced large-cap mining stock traders know that every large decline like this is simply the precursor to additional trend/swing moves, frequently in the other direction after a period of bottoming and basing. As we glance at FCX's daily graph, we find that after it finally bottomed on May 23 at $31.16, it proceeded to retest that low, bounced higher, put in a minor consolidation (blue box) and is now looking as if it might just want to make a run back up toward the 50-day exponential moving average (EMA) near $35.00. At the same time, the chart is also showing us that a slow yet steady bullish price/money flow divergence had been under way for some time (between mid-March and late May 2012) and that the divergence has indeed resolved as FCX has begun to move higher once again. |

|
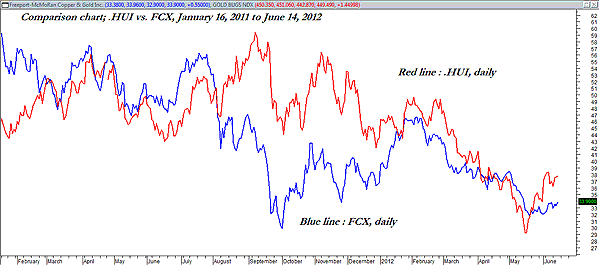
| FIGURE 2: FCX VS. HUI. Generally speaking, FCX will mimic most of the major moves in the Amex Gold Bugs index (.HUI), but there can be times when the two move at different speeds in the same direction -- or even in completely opposite directions, August 2011 being a prime example of such divergence. |
| Graphic provided by: MetaStock. |
| |
| How you play FCX on the long side here is pretty much determined by your particular trading style. Covered-call aficionados will no doubt be attracted by the stock's excellent option liquidity, high dividend yield and current upward momentum characteristics. Using near-term calls such as the July '12 34.00 will offer a trader a very nice $0.01 bid/ask spread and an open interest of more than 5,700 contracts. Moving up to the July '12 35.00 calls reveals that the open interest figure is better than 11,000 contracts -- maybe the smart money folks know a thing or two about FCX's next move that we don't? Hm. Swing traders might just go long an a buy-stop break above $33.96 and then place an initial stop near $32.85, ultimately reverting to a three-car trailing stop of the daily lows, should the trade gain traction. Partial profits might be taken near $35.00, the current level of the 50-day EMA in the stocks. Covered-call traders might consider using the 21-day EMA as their trailing stop, which will give the trade some "back and fill" room as the stock seeks its new price target, higher or lower. FCX can break out very quickly in either direction, so always make sure you've placed your initial/trailing stops ASAP after putting on a position, just in case the unexpected happens. In trading, your best offense is to always play a good defense. |
| With the broad markets waiting for more news out of Europe, this might be a good time to keep your trading on the more conservative side and consider the type of FCX covered-call trade; with gold being seen as a safe haven from the euro debt mess, shares of FCX might benefit during the waiting period until the head money moguls in the EU finally get their act together (Figure 2). And if they fail to come up with a workable plan, gold might decide to go on a nice little rally, pulling up FCX and other gold-centric shares higher as well. Time will tell, and always remember to keep your position sizes modest during times of great economic turmoil and chaos. |
Donald W. Pendergast is a financial markets consultant who offers specialized services to stock brokers and high net worth individuals who seek a better bottom line for their portfolios.
| Title: | Writer, market consultant |
| Company: | Linear Trading Systems LLC |
| Jacksonville, FL 32217 | |
| Phone # for sales: | 904-239-9564 |
| E-mail address: | lineartradingsys@gmail.com |
Traders' Resource Links | |
| Linear Trading Systems LLC has not added any product or service information to TRADERS' RESOURCE. | |
Click here for more information about our publications!
PRINT THIS ARTICLE

Request Information From Our Sponsors
- StockCharts.com, Inc.
- Candle Patterns
- Candlestick Charting Explained
- Intermarket Technical Analysis
- John Murphy on Chart Analysis
- John Murphy's Chart Pattern Recognition
- John Murphy's Market Message
- MurphyExplainsMarketAnalysis-Intermarket Analysis
- MurphyExplainsMarketAnalysis-Visual Analysis
- StockCharts.com
- Technical Analysis of the Financial Markets
- The Visual Investor
- VectorVest, Inc.
- Executive Premier Workshop
- One-Day Options Course
- OptionsPro
- Retirement Income Workshop
- Sure-Fire Trading Systems (VectorVest, Inc.)
- Trading as a Business Workshop
- VectorVest 7 EOD
- VectorVest 7 RealTime/IntraDay
- VectorVest AutoTester
- VectorVest Educational Services
- VectorVest OnLine
- VectorVest Options Analyzer
- VectorVest ProGraphics v6.0
- VectorVest ProTrader 7
- VectorVest RealTime Derby Tool
- VectorVest Simulator
- VectorVest Variator
- VectorVest Watchdog
