HOT TOPICS LIST
- MACD
- Fibonacci
- RSI
- Gann
- ADXR
- Stochastics
- Volume
- Triangles
- Futures
- Cycles
- Volatility
- ZIGZAG
- MESA
- Retracement
- Aroon
INDICATORS LIST
LIST OF TOPICS
PRINT THIS ARTICLE
by Koos van der Merwe
The Fisher-Gartman Risk Index uses a multi-asset class and global approach in measuring market performance.
Position: Accumulate
Koos van der Merwe
Has been a technical analyst since 1969, and has worked as a futures and options trader with First Financial Futures in Johannesburg, South Africa.
PRINT THIS ARTICLE
RSI
Measuring Market Performance
06/19/12 08:30:31 AMby Koos van der Merwe
The Fisher-Gartman Risk Index uses a multi-asset class and global approach in measuring market performance.
Position: Accumulate
| The Fisher-Gartman Risk Index, developed by Mark Fisher and Dennis Gartman, consists of a mix of long and short positions in various asset classes whose overall value is expected to rise when the outlook on markets and the broader economy is positive and fall when an outlook is negative. Mark Fisher has contributed to STOCKS & COMMODITIES magazine, and Dennis Gartman has a well-known trading newsletter. |

|
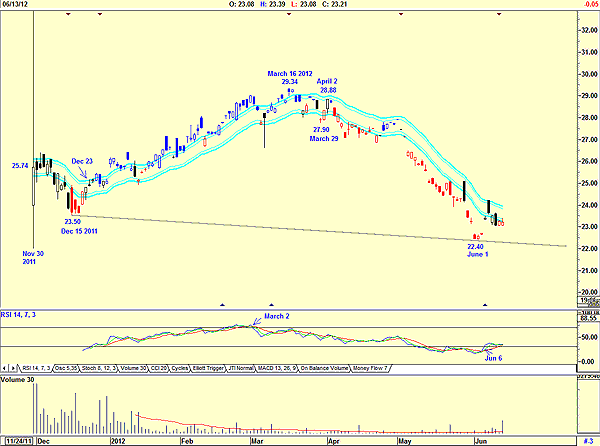
| FIGURE 1: FISHER GARTMAN RISK INDEX SUGGESTS STRENGTH |
| Graphic provided by: AdvancedGET. |
| |
| Figure 1 shows that the risk index came into being on November 30, 2011, finishing the day at $25.74. From that level it dropped to $23.50 by December 30, 2011. Note that the relative strength index (RSI) 14-period indicator was below the 32 level, suggesting strength. To be conservative in analyzing the indicator, I have added the JM internal band indicator using an offset of 1.5%. On December 23, the index broke above the upper JM internal band line, suggesting strength. The index moved to a high of $29.34 by March 16, 2012; however, note that the RSI suggested a sell on March 2 when the index was 28.42. The JM internal band indicator suggested a sell on March 29 when the index was at $27.90. The index then rose to $28.88, but did not break above the upper band suggesting a buy. The RSI continued to weaken. On June 6, the RSI gave a buy signal suggesting strength. The index has not given a buy on the conservative JM internal band indicator and appears to be consolidating at the 23.21 level. Volume is increasing on every up move, suggesting strength. |

|
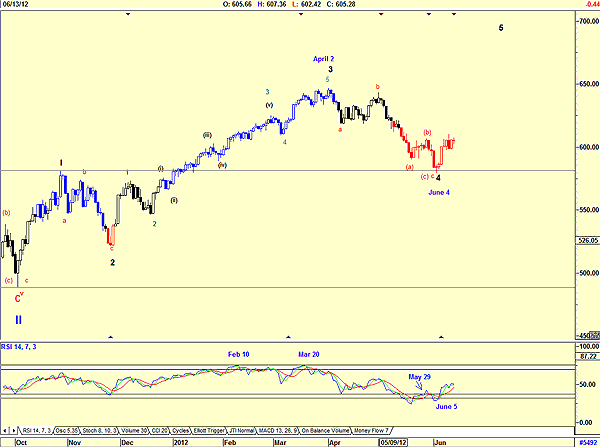
| FIGURE 2: S&P 100 |
| Graphic provided by: AdvancedGET. |
| |
| Figure 2 is a chart of the Standard & Poor's 100. The chart shows that the RSI suggested a sell on February 10, much too early. This sell signal was repeated on March 20. The RSI also suggested a buy signal on May 29. The index then fell to a new low by June 4, with the RSI giving a divergence buy on June 5, four days later than the buy signal given by the Fisher Gartman index. There is no doubt in my mind that the Fisher Gartman Risk Index is a leading indicator as to market direction. It should be watched carefully. |
Has been a technical analyst since 1969, and has worked as a futures and options trader with First Financial Futures in Johannesburg, South Africa.
| Address: | 3256 West 24th Ave |
| Vancouver, BC | |
| Phone # for sales: | 6042634214 |
| E-mail address: | petroosp@gmail.com |
Click here for more information about our publications!
PRINT THIS ARTICLE

Request Information From Our Sponsors
- StockCharts.com, Inc.
- Candle Patterns
- Candlestick Charting Explained
- Intermarket Technical Analysis
- John Murphy on Chart Analysis
- John Murphy's Chart Pattern Recognition
- John Murphy's Market Message
- MurphyExplainsMarketAnalysis-Intermarket Analysis
- MurphyExplainsMarketAnalysis-Visual Analysis
- StockCharts.com
- Technical Analysis of the Financial Markets
- The Visual Investor
- VectorVest, Inc.
- Executive Premier Workshop
- One-Day Options Course
- OptionsPro
- Retirement Income Workshop
- Sure-Fire Trading Systems (VectorVest, Inc.)
- Trading as a Business Workshop
- VectorVest 7 EOD
- VectorVest 7 RealTime/IntraDay
- VectorVest AutoTester
- VectorVest Educational Services
- VectorVest OnLine
- VectorVest Options Analyzer
- VectorVest ProGraphics v6.0
- VectorVest ProTrader 7
- VectorVest RealTime Derby Tool
- VectorVest Simulator
- VectorVest Variator
- VectorVest Watchdog
