HOT TOPICS LIST
- MACD
- Fibonacci
- RSI
- Gann
- ADXR
- Stochastics
- Volume
- Triangles
- Futures
- Cycles
- Volatility
- ZIGZAG
- MESA
- Retracement
- Aroon
INDICATORS LIST
LIST OF TOPICS
PRINT THIS ARTICLE
by Donald W. Pendergast, Jr.
After a major, sustained bullish trend move, there's always a consolidation before another rally and/or a reversal. Which will it be for shares of Wyndham Worldwide?
Position: N/A
Donald W. Pendergast, Jr.
Donald W. Pendergast is a financial markets consultant who offers specialized services to stock brokers and high net worth individuals who seek a better bottom line for their portfolios.
PRINT THIS ARTICLE
TRADING SYSTEMS
Wyndham Worldwide Set To Rise?
06/19/12 08:08:22 AMby Donald W. Pendergast, Jr.
After a major, sustained bullish trend move, there's always a consolidation before another rally and/or a reversal. Which will it be for shares of Wyndham Worldwide?
Position: N/A
| There's something awe-inspiring about a stock that can trend for months on end, grinding ever higher, week by week. It's almost enough to make you want to eliminate the word "overbought" from your technical trading vocabulary -- permanently. But what about when a long-trending stock goes into a sideways, range-bound phase? Does that mean that the stock is ready to turn lower or does it merely imply that it wants to take a rest before charging ever higher? Here's a look at the daily chart of Wyndham Worldwide (WYN) now, where we can see this same type of chart action unfolding. See Figure 1. |

|
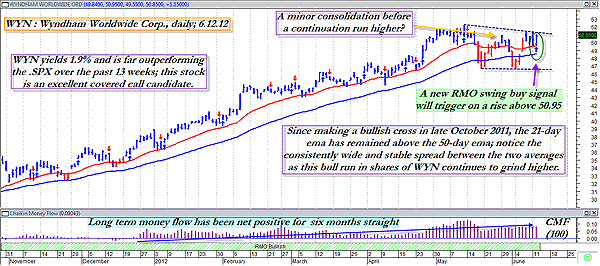
| FIGURE 1: WYN, DAILY. Stocks that tend to trend without making a lot of wild short-term swings may be good covered-call candidates, especially if long-term money flow is trending higher. |
| Graphic provided by: MetaStock. |
| Graphic provided by: RMO indicators from MetaStock 11. |
| |
| Since it experienced a bullish moving average crossover on October 26, 2011, WYN has risen by more than 55% in less than eight months. While this may seem like small potatoes in a world where a hot, flat-based breakout small-cap issue can rise that much in a matter of weeks, simple math will tell you that an average monthly gain of better than 6% in a world of 1% annual CD rates is pretty darned good. And with the spread between WYN's 21- and 50-period exponential moving averages (EMAs) remaining relatively wide, this uptrend must still be given every benefit of the doubt, even though the stock has been in a consolidating mode since mid-May 2012. Here are the technicals that appear to indicate that the path of least resistance in WYN is heading toward higher valuations -- in the near term, at least: 1. The long-term money flow (based on the 100-period Chaikin money flow histogram [CMF][100]) has been above its zero line for more than six months now, never once dipping below the line. 2. The absolute value of that histogram is still well above the zero line. 3. The RMO (Rahul Mohindar) trading system from MetaStock 11 has just fired a swing buy signal. 4. This buy signal will trigger on a near-term rise above $50.95, which may also precipitate a push up through the overhead resistance line at approximately $51.38 (see dashed blue lines on the chart). 5. WYN has exceptionally strong 13-week comparative relative strength versus the Standard & Poor's 500 (.SPX, SPY), far outperforming this key large-cap index. See Figure 2. |

|
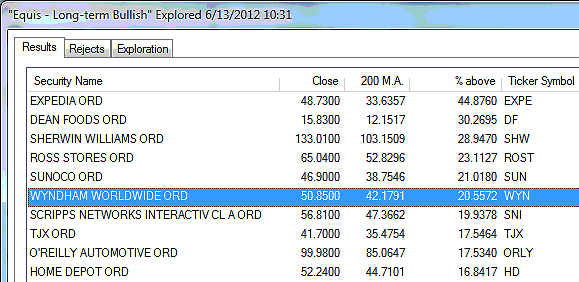
| FIGURE 2: LARGE-CAPS. Here are 10 large caps that are trading well above their respective 200-day moving averages. |
| Graphic provided by: MetaStock. |
| Graphic provided by: MetaStock Explorer. |
| |
| With the economic situation in Europe still uncertain, traders and investors may want to keep at least a portion of their funds in dividend-paying, high relative strength stocks that also feature healthy long-term money flow trends, and from all appearances, WYN is certainly a stock to consider when based on those criteria. One of the better ways to play WYN now is to consider putting on a July '12 50.00 covered call. This uses a slightly in-the-money call option that has a little over five weeks of time value remaining (meaning it will soon experience rapid time value decay). This call also has more than 2,000 contracts of open interest at that particular strike and has decent daily volume. The spread on the call is about $0.15, so try to work your best deal as you attempt to put the entire trade on as a buy-write package. If filled on the trade at your desired price, consider using that red 21-period EMA as your trailing stop for the entire life of the trade, no matter if the stock is called away at expiry, if the stock makes a daily close below the EMA or if the call expires worthless and you're left holding your shares of WYN. In the latter scenario, you could always opt to sell another near-term call against every 100 shares you own of WYN, provided the technicals still look attractive. Market dynamics, chart patterns, and investor sentiment are always constantly changing variables, and those traders/investors who can manage to interpret them are the ones who will have a higher probability of making money over the long haul, provided they use risk control at all times. |
Donald W. Pendergast is a financial markets consultant who offers specialized services to stock brokers and high net worth individuals who seek a better bottom line for their portfolios.
| Title: | Writer, market consultant |
| Company: | Linear Trading Systems LLC |
| Jacksonville, FL 32217 | |
| Phone # for sales: | 904-239-9564 |
| E-mail address: | lineartradingsys@gmail.com |
Traders' Resource Links | |
| Linear Trading Systems LLC has not added any product or service information to TRADERS' RESOURCE. | |
Click here for more information about our publications!
PRINT THIS ARTICLE

Request Information From Our Sponsors
- StockCharts.com, Inc.
- Candle Patterns
- Candlestick Charting Explained
- Intermarket Technical Analysis
- John Murphy on Chart Analysis
- John Murphy's Chart Pattern Recognition
- John Murphy's Market Message
- MurphyExplainsMarketAnalysis-Intermarket Analysis
- MurphyExplainsMarketAnalysis-Visual Analysis
- StockCharts.com
- Technical Analysis of the Financial Markets
- The Visual Investor
- VectorVest, Inc.
- Executive Premier Workshop
- One-Day Options Course
- OptionsPro
- Retirement Income Workshop
- Sure-Fire Trading Systems (VectorVest, Inc.)
- Trading as a Business Workshop
- VectorVest 7 EOD
- VectorVest 7 RealTime/IntraDay
- VectorVest AutoTester
- VectorVest Educational Services
- VectorVest OnLine
- VectorVest Options Analyzer
- VectorVest ProGraphics v6.0
- VectorVest ProTrader 7
- VectorVest RealTime Derby Tool
- VectorVest Simulator
- VectorVest Variator
- VectorVest Watchdog
