HOT TOPICS LIST
- MACD
- Fibonacci
- RSI
- Gann
- ADXR
- Stochastics
- Volume
- Triangles
- Futures
- Cycles
- Volatility
- ZIGZAG
- MESA
- Retracement
- Aroon
INDICATORS LIST
LIST OF TOPICS
PRINT THIS ARTICLE
by Mike Carr, CMT
Relative strength is a powerful trading tool, but its signals can be difficult to interpret. Applying indicators to relative strength can help.
Position: Sell
Mike Carr, CMT
Mike Carr, CMT, is a member of the Market Technicians Association, and editor of the MTA's newsletter, Technically Speaking. He is also the author of "Smarter Investing in Any Economy: The Definitive Guide to Relative Strength Investing," and "Conquering the Divide: How to Use Economic Indicators to Catch Stock Market Trends."
PRINT THIS ARTICLE
RSI
Combine MACD And Relative Strength To Time Trades
06/15/12 08:29:17 AMby Mike Carr, CMT
Relative strength is a powerful trading tool, but its signals can be difficult to interpret. Applying indicators to relative strength can help.
Position: Sell
| Indicators are widely used by traders to time entries and exits. The idea behind this is that the indicator smoothes the price action and offers more reliable signals than price alone. Moving average convergence/divergence (MACD) is a popular indicator and could be used as a stand-alone trading strategy. Many traders also use relative strength (RS), which can highlight stocks that are outperforming the market. Here, the theory is that outperformance is likely to continue, so owning the strongest stocks can deliver market-beating performance over time. RS can be charted like price and trades can be taken when RS is rising, or trades might be taken when RS is below some arbitrary level such as 80 (which indicates the stock is outperforming 80% of the other stocks). The disadvantages of these ideas are: if RS is charted, the data is choppy just like it would be with price, and calculations of numeric RS ranks often requires a subscription service to monitor the ranks. |
| Both of those weaknesses can be overcome with an additional RS technique that traders should consider, the momentum of comparative strength (MoCS) indicator developed by market technician Christopher Hendrix. MoCS substitutes an RS calculation for price into the traditional MACD formula. The theory behind MoCS is that a stock's momentum can highlight when prices are changing directions. A positive value of MoCS would show that momentum is rising and a negative MoCS should highlight downtrends in price. The formula for MoCS is: MoCS = (12-period EMA of (Stock/S&P 500)) - (26-period EMA (Stock/S&P 500)) where EMA represents an exponential moving average. Stock represents the closing price of the stock being evaluated, and the Standard & Poor's 500 represents the close of the S&P 500. |
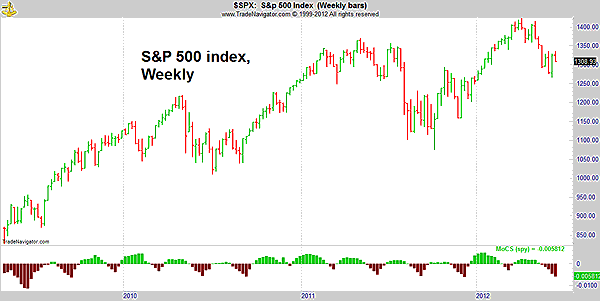
| In trading software, each program will require different forms of this equation. In Trade Navigator software, it would simply be "MACD (Close / Close of SP, 12, 26)," where SP is the value of the S&P 500 exchange traded fund (ETF), SPY, although any index or ETF that tracks an index could be used here. This formula could be used to chart an indicator like the one shown in Figure 1. |

|
| FIGURE 1: SPX, WEEKLY. The S&P 500 is shown with the MoCS indicator, which looks like a MACD histogram. |
| Graphic provided by: Trade Navigator. |
| |
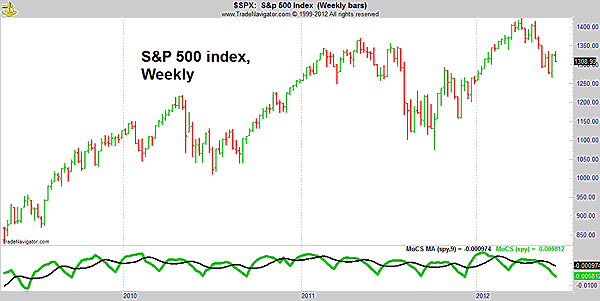
| Figure 1 shows that this approach offers clearly defined signals as the MoCS moves above and below the zero line. It is also possible to add a moving average to MoCS as a signal line; a nine-period moving average is used as the default, as it is for the MACD calculation, although all of the variables of MoCS could be changed. The signal line and indicator approach is shown in Figure 2. |

|
| FIGURE 2: SPX, WEEKLY. The MoCS is shown as the green line with a nine-week moving average added as the black line to provide trading signals. |
| Graphic provided by: Trade Navigator. |
| |
| Backtesting shows that this indicator (with the histogram approach) offers a good starting point for developing a robust trading strategy. Long-only, trading SPY when the MoCS histogram is positive and moving to cash when it is negative, the profit factor is a healthy 3.21 using data from the beginning of 1991 and weekly signals. A similar profit factor (3.30) is obtained when testing on the more volatile NASDAQ 100 ETF (QQQ). Profits are lower with the signal line added in testing, but the system is still tradable. Variations of this strategy (different parameters or time frames) could offer better results. |
Mike Carr, CMT, is a member of the Market Technicians Association, and editor of the MTA's newsletter, Technically Speaking. He is also the author of "Smarter Investing in Any Economy: The Definitive Guide to Relative Strength Investing," and "Conquering the Divide: How to Use Economic Indicators to Catch Stock Market Trends."
| Website: | www.moneynews.com/blogs/MichaelCarr/id-73 |
| E-mail address: | marketstrategist@gmail.com |
Click here for more information about our publications!
Comments
Date: 06/25/12Rank: Comment: the formula relates a stock to the S P, so how can you use the
S P by itself ? Isn t this just
the MACD alone? John Lerch

Request Information From Our Sponsors
- VectorVest, Inc.
- Executive Premier Workshop
- One-Day Options Course
- OptionsPro
- Retirement Income Workshop
- Sure-Fire Trading Systems (VectorVest, Inc.)
- Trading as a Business Workshop
- VectorVest 7 EOD
- VectorVest 7 RealTime/IntraDay
- VectorVest AutoTester
- VectorVest Educational Services
- VectorVest OnLine
- VectorVest Options Analyzer
- VectorVest ProGraphics v6.0
- VectorVest ProTrader 7
- VectorVest RealTime Derby Tool
- VectorVest Simulator
- VectorVest Variator
- VectorVest Watchdog
- StockCharts.com, Inc.
- Candle Patterns
- Candlestick Charting Explained
- Intermarket Technical Analysis
- John Murphy on Chart Analysis
- John Murphy's Chart Pattern Recognition
- John Murphy's Market Message
- MurphyExplainsMarketAnalysis-Intermarket Analysis
- MurphyExplainsMarketAnalysis-Visual Analysis
- StockCharts.com
- Technical Analysis of the Financial Markets
- The Visual Investor
