HOT TOPICS LIST
- MACD
- Fibonacci
- RSI
- Gann
- ADXR
- Stochastics
- Volume
- Triangles
- Futures
- Cycles
- Volatility
- ZIGZAG
- MESA
- Retracement
- Aroon
INDICATORS LIST
LIST OF TOPICS
PRINT THIS ARTICLE
by Bruce Tintelnot
It's good to know when to enter or exit a transaction. Momentum indicators can give a trader some clues.
Position: N/A
Bruce Tintelnot
Bruce Tintelnot is a writer and researcher in the area of business, particularly investing and the economy. His qualifications include a bachelor's degree in business administration with a financial major, online trading experience in the stock and foreign currency markets with a good knowledge of technical analysis and fundamental analysis.
PRINT THIS ARTICLE
MOMENTUM
A Look At Momentum
06/18/12 01:00:16 PMby Bruce Tintelnot
It's good to know when to enter or exit a transaction. Momentum indicators can give a trader some clues.
Position: N/A
| Investing successfully in the capital markets requires being able to enter a trade and exit with a profit. Most traders try to optimize their profits, and using an indicator that measures the price momentum is helpful for this. Some such indicators would be momentum, rate of change indicator (ROC), relative strength index (RSI), and the stochastic oscillator. |
| Momentum is the rate at which prices on a chart are rising or falling. The indicators that measure this look at the closing price in relation to the previous closing price, price range, moving average or previous high/low price. Momentum plots points above or below a center line that indicates a zero value. A 10-day graph is typical, and it gives some indication of strength (above zero) or weakness (below zero) in the price movements of a security. Knowing the momentum of prices is an indicator of the strength of a trend. When momentum or price strength is strong in either direction, the trend is also strong. Uptrends tend to stay above the zero line, and the reverse is true for downtrends. In addition, trends don't necessarily end when momentum falls below the zero line; this is usually a sign that a trend is weakening. Weakness in momentum occurs at the beginning and end of trends. |
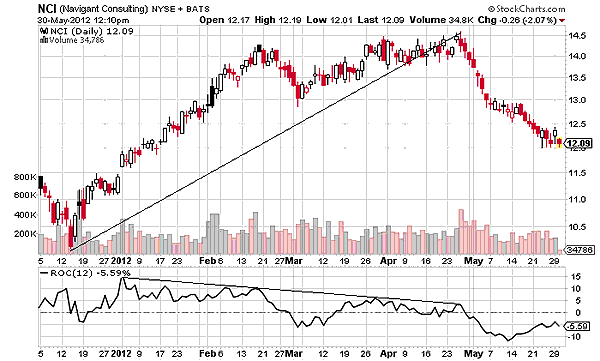
| The ROC indicator is considered the closest thing to pure momentum. It measures the percentage rate of price changes as they progress through time, and its trading signals are identical to those for momentum. Its formula is: ROC = [(Closing price - Closing price n periods ago)/Closing price n periods ago] * 100 See Figure 1. |

|
| FIGURE 1: NCI, DAILY. This graph displays a weakening in price strength between January 2012 and the end of April, concluding with a trend reversal through May. Trendlines drawn on both the price chart and the ROC happen to diverge, ending with falling prices. This does not always happen. |
| Graphic provided by: StockCharts.com. |
| Graphic provided by: MS Paint. |
| |
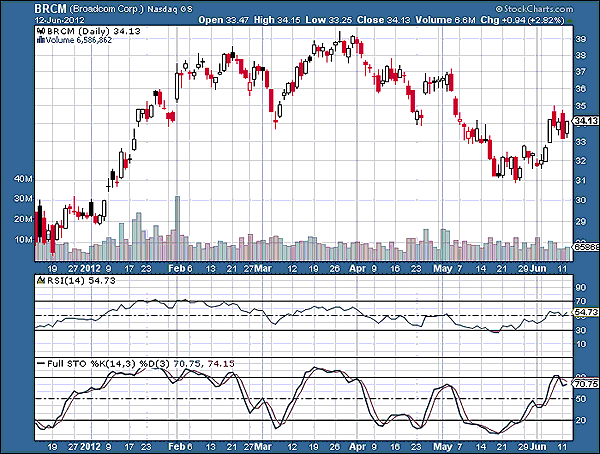
| The charts for momentum and ROC have no boundaries. They can go upward indefinitely and fall until a stock's value reaches zero. Boundary lines can be added that include the extreme upper and lower margins of a chart's price movements around a center line indicating when a price is at overbought or oversold levels. This arrangement is known as an oscillator and is particularly useful when trying to determine entry and exit points in ranging markets. Two popular oscillators are the RSI and the stochastic oscillator. The RSI compares upward and downward movements of closing prices by plotting a single line that usually uses an upper boundary of 70% and a lower one of 30%. The stochastic uses two moving averages, the %K and %D, to measure momentum. The overbought area of the chart is usually at 80% and the oversold area is at 20%. Buy and sell signals can be determined when the %K line crosses over the %D line in the upper or lower margins. See Figure 2. |

|
| FIGURE 2: BRCM, DAILY. This chart displays the RSI and the stochastic oscillator. |
| Graphic provided by: StockCharts.com. |
| |
| Momentum is the simplest of the indicators in technical analysis that can cause it to be overlooked by many in favor of more elaborate ones. But it can be used quite as well as most indicators, and a fair degree of accuracy can be achieved when it is used skillfully with contrasting ones that measure trend, volatility, or volume. |
Bruce Tintelnot is a writer and researcher in the area of business, particularly investing and the economy. His qualifications include a bachelor's degree in business administration with a financial major, online trading experience in the stock and foreign currency markets with a good knowledge of technical analysis and fundamental analysis.
| Title: | Freelance Writer |
| Website: | textwriter2.webs.com |
| E-mail address: | brucetintelnot@aol.com |
Click here for more information about our publications!
PRINT THIS ARTICLE

Request Information From Our Sponsors
- VectorVest, Inc.
- Executive Premier Workshop
- One-Day Options Course
- OptionsPro
- Retirement Income Workshop
- Sure-Fire Trading Systems (VectorVest, Inc.)
- Trading as a Business Workshop
- VectorVest 7 EOD
- VectorVest 7 RealTime/IntraDay
- VectorVest AutoTester
- VectorVest Educational Services
- VectorVest OnLine
- VectorVest Options Analyzer
- VectorVest ProGraphics v6.0
- VectorVest ProTrader 7
- VectorVest RealTime Derby Tool
- VectorVest Simulator
- VectorVest Variator
- VectorVest Watchdog
- StockCharts.com, Inc.
- Candle Patterns
- Candlestick Charting Explained
- Intermarket Technical Analysis
- John Murphy on Chart Analysis
- John Murphy's Chart Pattern Recognition
- John Murphy's Market Message
- MurphyExplainsMarketAnalysis-Intermarket Analysis
- MurphyExplainsMarketAnalysis-Visual Analysis
- StockCharts.com
- Technical Analysis of the Financial Markets
- The Visual Investor
