HOT TOPICS LIST
- MACD
- Fibonacci
- RSI
- Gann
- ADXR
- Stochastics
- Volume
- Triangles
- Futures
- Cycles
- Volatility
- ZIGZAG
- MESA
- Retracement
- Aroon
INDICATORS LIST
LIST OF TOPICS
PRINT THIS ARTICLE
by Donald W. Pendergast, Jr.
Up by more than 85% since August 2011, shares of Sherwin-Williams may be poised to run even higher.
Position: N/A
Donald W. Pendergast, Jr.
Donald W. Pendergast is a financial markets consultant who offers specialized services to stock brokers and high net worth individuals who seek a better bottom line for their portfolios.
PRINT THIS ARTICLE
TRADING SYSTEMS
Ask Sherwin-Williams -- Will The Bull Continue?
06/15/12 08:14:08 AMby Donald W. Pendergast, Jr.
Up by more than 85% since August 2011, shares of Sherwin-Williams may be poised to run even higher.
Position: N/A
| For risk-averse long term traders/investors, the steady uptrend in shares of Sherwin-Williams (SHW) is like a heaven-sent bit of relief against a market backdrop that looks like a topsy-turvy war zone. Here's a closer look at this long-trending stock now (Figures 1 and 2). |

|
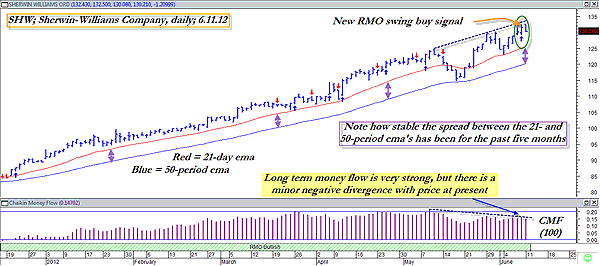
| FIGURE 1: SHW, DAILY. Steadily trending stocks with strong long-term money flow can make excellent covered-call trading candidates. |
| Graphic provided by: MetaStock. |
| Graphic provided by: RMO indicators from MetaStock 11. |
| |
| Ever wonder about the trendworthiness of a stock, especially if you tend to trade covered-call plays in big-cap stocks? There are several ways do this, including: 1. Examine your charts, noting which stocks are exhibiting a pattern of higher swing highs and higher swing lows, preferably on multiple time frames (daily, weekly, monthly, and so on) 2. Use a series of trendlines, always using significant swing lows as the anchor points for each particular trendline 3. Use moving average crossovers to identify a trending stock. For example, when a nine-period exponential moving average (EMA) crosses above an 18-period EMA, some traders believe this confirms a bullish trending phase, one that may continue. Or you can use this method instead -- it's not foolproof, but it can be an added tool in your technical arsenal as you seek to locate the stocks that have the highest probability of bullish follow-through, something that is of vital importance to those seeking to profit from covered-call plays. Here's the way to do it: 1. In your charting software, simply plot (preferably in different colors) a 21-period EMA and a 50-period EMA in each time frame you plan to trade 2. Observe and see if the 21-period EMA is above the 50-period EMA 3. If it is above the 50-period, look and see if the spread is relatively stable, for at least two or three months if you're using a daily chart. If you note that your stock has been trending nicely with a nice and relatively smooth and stable spread, as is the case in our daily chart of SHW, then you want to check out a couple of other things before you consider putting on a near-term covered-call trade, one designed to take advantage of a persistent trend: 1. Check the long-term money flow pattern, preferably by using a 100-period Chaikin money flow (CMF)(100) histogram. Make sure that the histogram has been above its zero line for at least three months or more, with no dips below the line at all 2. Make sure that the current reading of the histogram is at least 70% as high as the highest value it has ever attained during its continuous time spent above the zero line 3. Make sure that any negative money flow divergence is minor; following rule 2 should help keep you out of trouble 4. Finally, ensure that the stock is outperforming the .SPX over the past four- and 13-week periods. |

|
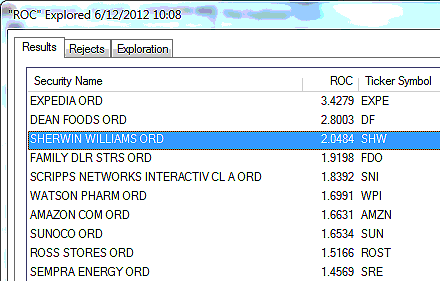
| FIGURE 2: LARGE CAPS. Here are just 10 of the large caps that are firing new RMO swing buy signals. All 10 are greatly outperforming the .SPX over the past calendar quarter. |
| Graphic provided by: MetaStock. |
| Graphic provided by: MetaStock Explorer. |
| |
| In our example of SHW, the stock easily passes all four of those simple, no-nonsense criteria and therefore might be considered a relatively low-risk covered-call setup, particularly if created with call options with no more than three to six weeks of time value remaining. Even though SHW has trended so well since last summer, we still have no guarantee at all that the stock will continue to rise, and if so, at what rate. Therefore, it usually pays to err on the side of caution when considering the expirations of the call strikes that you wish to trade. At present, the spread on the July 135 calls is only 0.20 (not great but still passable, given the outstanding bullish technicals on the stock), and if you decide to trade this setup, consider using the red 21-period EMA as your de facto trailing stop-loss on the trade until the calls expire, SHW closes beneath that EMA (currently near 126.00), and/or the stock is called away. All of the calls at the 130, 135 and 140 strikes have decent open interest. Of course, even with all of these bullish technicals, you still need to limit risk for the times when the setups just don't seem to want to cooperate with your plan to make money in the market. Risking a maximum of only 1% to 2% might be one of the lowest-cost insurance policies you ever acquire as you continue to trade the markets, week after week. |
Donald W. Pendergast is a financial markets consultant who offers specialized services to stock brokers and high net worth individuals who seek a better bottom line for their portfolios.
| Title: | Writer, market consultant |
| Company: | Linear Trading Systems LLC |
| Jacksonville, FL 32217 | |
| Phone # for sales: | 904-239-9564 |
| E-mail address: | lineartradingsys@gmail.com |
Traders' Resource Links | |
| Linear Trading Systems LLC has not added any product or service information to TRADERS' RESOURCE. | |
Click here for more information about our publications!
PRINT THIS ARTICLE

Request Information From Our Sponsors
- StockCharts.com, Inc.
- Candle Patterns
- Candlestick Charting Explained
- Intermarket Technical Analysis
- John Murphy on Chart Analysis
- John Murphy's Chart Pattern Recognition
- John Murphy's Market Message
- MurphyExplainsMarketAnalysis-Intermarket Analysis
- MurphyExplainsMarketAnalysis-Visual Analysis
- StockCharts.com
- Technical Analysis of the Financial Markets
- The Visual Investor
- VectorVest, Inc.
- Executive Premier Workshop
- One-Day Options Course
- OptionsPro
- Retirement Income Workshop
- Sure-Fire Trading Systems (VectorVest, Inc.)
- Trading as a Business Workshop
- VectorVest 7 EOD
- VectorVest 7 RealTime/IntraDay
- VectorVest AutoTester
- VectorVest Educational Services
- VectorVest OnLine
- VectorVest Options Analyzer
- VectorVest ProGraphics v6.0
- VectorVest ProTrader 7
- VectorVest RealTime Derby Tool
- VectorVest Simulator
- VectorVest Variator
- VectorVest Watchdog
