HOT TOPICS LIST
- MACD
- Fibonacci
- RSI
- Gann
- ADXR
- Stochastics
- Volume
- Triangles
- Futures
- Cycles
- Volatility
- ZIGZAG
- MESA
- Retracement
- Aroon
INDICATORS LIST
LIST OF TOPICS
PRINT THIS ARTICLE
by Billy Williams
Strong trends produce runaway gaps that can be difficult to trade unless you have the right approach.
Position: Hold
Billy Williams
Billy Williams has been trading the markets for 27 years, specializing in momentum trading with stocks and options.
PRINT THIS ARTICLE
GAPS
Persistent Trends And Runaway Gaps
06/14/12 08:30:34 AMby Billy Williams
Strong trends produce runaway gaps that can be difficult to trade unless you have the right approach.
Position: Hold
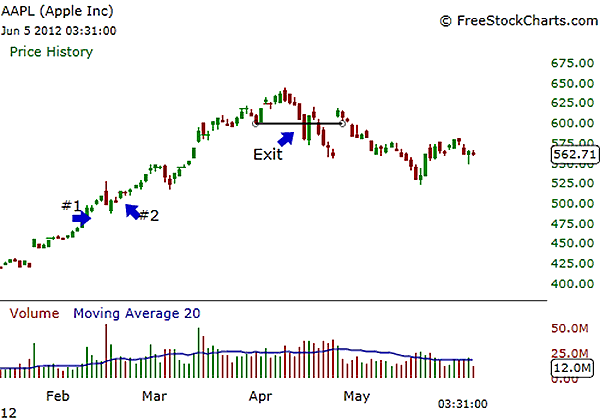
| A running water hose whose flow is cut off at some point will begin to grow in pressure till it reaches the point of no return. When that blockage is released, the blowoff of water pressure erupts so violently, it can catch you off guard until it's too late. It's the same way with stocks when new information is introduced to the market that drives up demand to accumulate more shares or dump the shares altogether, resulting in a gap in the stock's price action. There are several types of price gaps in trading, but the type of gap that forms in this context is the runaway gap. Runaway gaps experience a type of blastoff similar to a missile launch where the gap forms in the direction of its dominant trend, which can signal a golden opportunity, while other traders run for cover for things to clear up. See Figures 1 and 2. |

|
| FIGURE 1: AAPL. At point 1, Apple Inc. forms a runaway gap inside of a persistent bullish trend and then pulls back slightly in price a few days later. At point 1, price resumes its trend and signals an entry. By trailing your stop and adjusting it under each new price low, you can easily ride the wave higher until price stops you out. |
| Graphic provided by: www.freestockcharts.com. |
| |
| The downside, however, is that trying to chase an explosive price pattern like this can be like trying to grab a wisp of smoke where you can see it form but fail to grab anything substantive. A runaway gap can be classified as such if it follows a visibly confirmed trend. If a confirmed trend is in place, it doesn't have to be strongly bullish or bearish but it has to be distinctly visible and not include any sort of sideways movement. The gap validates the existing trend and highlights a persistent interest in the instrument in the market. |

|
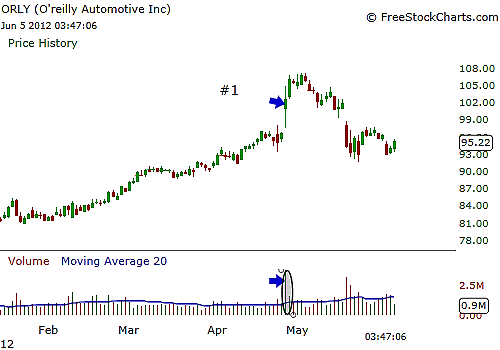
| FIGURE 2: ORLY. You have to be careful if you see what you think is a runaway gap form on large spikes of trade volume when a stock has been in a trend for a long time. ORLY had been trading higher when volume spiked to almost 400% its normal range. This turned out to be an exhaustion gap instead and marked the end of the move rather than a continuation with a runaway gap. |
| Graphic provided by: www.freestockcharts.com. |
| |
| The size of the gap is in the price pattern is referred to as the "measuring gap," which reveals the difference between the close of the former trading day and the following trading day's price open. This is important to note because they form support and resistance points within this price difference, and if the price breaks through these price levels followed by falling back to close that gap, then it could be signaling an exit. |
| Trading runaway gaps also has an advantage in that you don't have to have years of trading experience to be able to identify the setup. The gap provides a visual mark for the stop-loss level that you should use on a trade. With the actual management of the trade, you can catch a home-run trade every now and then but make short quick profits by liquidating half your position when you gain twice your risk or more and then raising your stops on the remaining half of your position. |
| For bullish trades, wait for the first trading day where the intraday low trades underneath the previous two trading days' intraday low, then take a position when price resumes trading above the intraday high of that same day. For shorts, wait for the first trading day that trades above the previous two days' intraday high and then take a position as the price resumes its downward decline when it passes that trading day's intraday high. |
Billy Williams has been trading the markets for 27 years, specializing in momentum trading with stocks and options.
| Company: | StockOptionSystem.com |
| E-mail address: | stockoptionsystem.com@gmail.com |
Traders' Resource Links | |
| StockOptionSystem.com has not added any product or service information to TRADERS' RESOURCE. | |
Click here for more information about our publications!
Comments

Request Information From Our Sponsors
- StockCharts.com, Inc.
- Candle Patterns
- Candlestick Charting Explained
- Intermarket Technical Analysis
- John Murphy on Chart Analysis
- John Murphy's Chart Pattern Recognition
- John Murphy's Market Message
- MurphyExplainsMarketAnalysis-Intermarket Analysis
- MurphyExplainsMarketAnalysis-Visual Analysis
- StockCharts.com
- Technical Analysis of the Financial Markets
- The Visual Investor
- VectorVest, Inc.
- Executive Premier Workshop
- One-Day Options Course
- OptionsPro
- Retirement Income Workshop
- Sure-Fire Trading Systems (VectorVest, Inc.)
- Trading as a Business Workshop
- VectorVest 7 EOD
- VectorVest 7 RealTime/IntraDay
- VectorVest AutoTester
- VectorVest Educational Services
- VectorVest OnLine
- VectorVest Options Analyzer
- VectorVest ProGraphics v6.0
- VectorVest ProTrader 7
- VectorVest RealTime Derby Tool
- VectorVest Simulator
- VectorVest Variator
- VectorVest Watchdog
