HOT TOPICS LIST
- MACD
- Fibonacci
- RSI
- Gann
- ADXR
- Stochastics
- Volume
- Triangles
- Futures
- Cycles
- Volatility
- ZIGZAG
- MESA
- Retracement
- Aroon
INDICATORS LIST
LIST OF TOPICS
PRINT THIS ARTICLE
by Koos van der Merwe
In times of uncertainty, look for income on your investment.
Position: Accumulate
Koos van der Merwe
Has been a technical analyst since 1969, and has worked as a futures and options trader with First Financial Futures in Johannesburg, South Africa.
PRINT THIS ARTICLE
RSI
Look For Income With Hatteras Financial?
06/13/12 11:19:46 AMby Koos van der Merwe
In times of uncertainty, look for income on your investment.
Position: Accumulate
| With events in Europe scaring investors, with the "sell in May and go away" mantra proving effective this year, and with the school year ending soon, with many market players taking a holiday (if they can afford one), with the US preparing for a Presidential election, and finally, with a wariness of any good news that hits the streets especially after the Facebook listing debacle, investors sleep better by placing their money in shares with low volatility -- shares that give them a comfortable dividend or interest return. One such share is Hatteras Financial Corp., offering a dividend yield of 12.4% at a price of $29.03. Hatteras Financial is an externally managed mortgage real estate investment trust. The company invests in adjustable-rate and hybrid adjustable-rate single-family residential mortgage pass-through securities issued or guaranteed by US government agencies or US government-sponsored entities, such as Fannie Mae, Freddie Mac, or Ginnie Mae. Admittedly, with the recent mortgage-backed security crises, a company investing in mortgages would scare many investors; on the other hand, a company aware of the recent pitfalls, a company formed in 2007 knowing about the mortgage fiasco, would be very careful with their investments. |

|
| FIGURE 1: HATTERAS, WEEKLY |
| Graphic provided by: AdvancedGET. |
| |
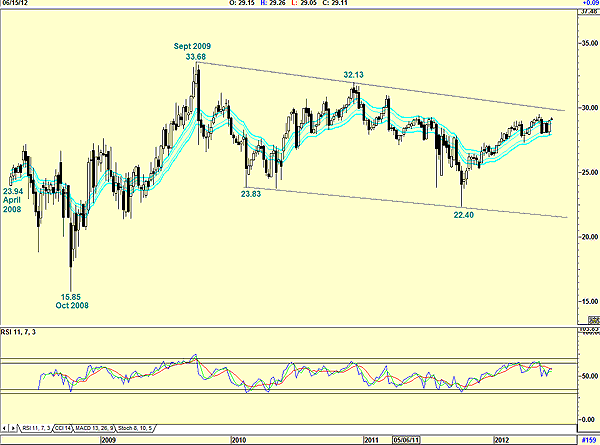
| The share hit the market at $23.94 in April 2008. Figure 1, a weekly chart, shows how the price fell to $15.85 by October 2008. It then rose to a high of $33.68 in the following year, and since then, it has been trading in a range between $23.83 and $32.13, then back to $22.40 before rising to present levels. The share price is still positive with the JM internal band indicator, but the relative strength index (RSI) is suggesting weakness. |

|
| FIGURE 2: HATTERAS, DAILY |
| Graphic provided by: AdvancedGET. |
| |
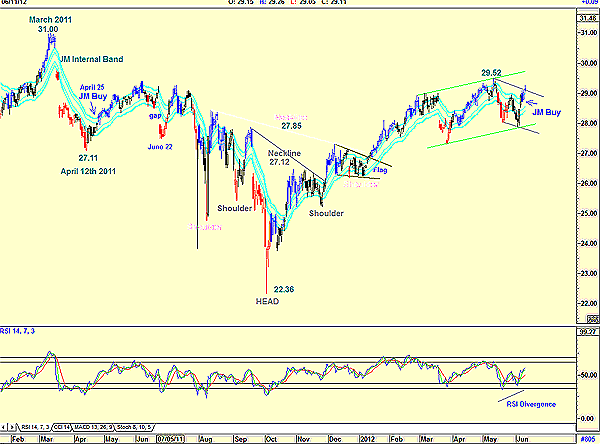
| A daily chart shown in Figure 2 shows how the price dropped from $31 in March 2011, giving a sell signal by breaking below the lower band of the JM internal band indicator on a gap to a low of $27.11 by April 12, 2011. The RSI fell with the share price, but the buy signals given were not convincing. On April 25, however, the price gave a buy signal by breaking above the upper JM band but gave a JM sell signal when it fell on a gap on June 22. With the RSI now in doubt, and the conservative JM internal band indicator also not performing as well as expected, looking for an indicator that will be successful becomes a must. The inverse head & shoulders pattern that formed captured my attention, and I started watching the share price looking for an entry level. The chart shows two possible shoulder levels that could have formed, with the necklines suggesting target of $33.34 (27.85 - 22.36 = 5.49 + 27.85 = 33.34) or $31.88 (27.12 - 22.36 = 4.76 + 27.12 = 31.88). Would you have taken the chance and bought the share? The yield looked tempting and with the flag pattern that developed at the second shoulder, you may have taken the risk. The present RSI divergence that has formed, with a JM internal band buy signal, would be very tempting at the moment. I would be a buyer of Hatteras Financial at present levels. All the indicators look positive, and the present dividend yield looks extremely attractive. However, I would keep my stops close. |
Has been a technical analyst since 1969, and has worked as a futures and options trader with First Financial Futures in Johannesburg, South Africa.
| Address: | 3256 West 24th Ave |
| Vancouver, BC | |
| Phone # for sales: | 6042634214 |
| E-mail address: | petroosp@gmail.com |
Click here for more information about our publications!
PRINT THIS ARTICLE

Request Information From Our Sponsors
- StockCharts.com, Inc.
- Candle Patterns
- Candlestick Charting Explained
- Intermarket Technical Analysis
- John Murphy on Chart Analysis
- John Murphy's Chart Pattern Recognition
- John Murphy's Market Message
- MurphyExplainsMarketAnalysis-Intermarket Analysis
- MurphyExplainsMarketAnalysis-Visual Analysis
- StockCharts.com
- Technical Analysis of the Financial Markets
- The Visual Investor
- VectorVest, Inc.
- Executive Premier Workshop
- One-Day Options Course
- OptionsPro
- Retirement Income Workshop
- Sure-Fire Trading Systems (VectorVest, Inc.)
- Trading as a Business Workshop
- VectorVest 7 EOD
- VectorVest 7 RealTime/IntraDay
- VectorVest AutoTester
- VectorVest Educational Services
- VectorVest OnLine
- VectorVest Options Analyzer
- VectorVest ProGraphics v6.0
- VectorVest ProTrader 7
- VectorVest RealTime Derby Tool
- VectorVest Simulator
- VectorVest Variator
- VectorVest Watchdog
