HOT TOPICS LIST
- MACD
- Fibonacci
- RSI
- Gann
- ADXR
- Stochastics
- Volume
- Triangles
- Futures
- Cycles
- Volatility
- ZIGZAG
- MESA
- Retracement
- Aroon
INDICATORS LIST
LIST OF TOPICS
PRINT THIS ARTICLE
by Donald W. Pendergast, Jr.
Gold stocks have seen a modest rebound over the past two weeks; which ones are showing the most relative strength?
Position: N/A
Donald W. Pendergast, Jr.
Donald W. Pendergast is a financial markets consultant who offers specialized services to stock brokers and high net worth individuals who seek a better bottom line for their portfolios.
PRINT THIS ARTICLE
CHART ANALYSIS
AEM A Saucer Pattern Buy?
06/14/12 08:14:59 AMby Donald W. Pendergast, Jr.
Gold stocks have seen a modest rebound over the past two weeks; which ones are showing the most relative strength?
Position: N/A
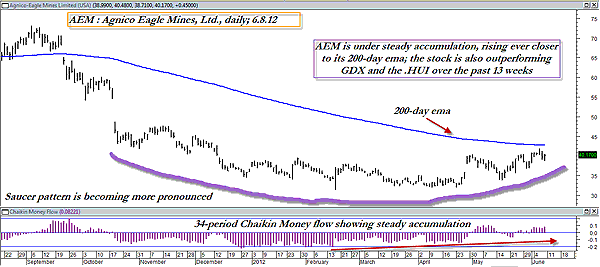
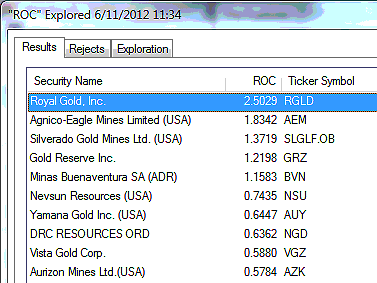
| With all of the recent turmoil in Europe lately, it's not surprising that precious metals stocks are catching a nice bid. The Market Vectors Gold Miners ETF (GDX) is up by almost 18% since making a major swing low on May 16, 2012 at $39.06. Currently, shares of Agnico-Eagle Mines are leading the pack of gold stocks in terms of comparative relative strength versus GDX, and as we take a look at its fascinating daily chart, we can easily discern the technical chart pattern that is driving AEM higher. See Figures 1 and 2. |

|
| FIGURE 1: AEM, DAILY. While this saucer pattern in AEM may very well find that the 200-day EMA will offer some resistance to further near-term gains, the saucer pattern itself may be suggesting that a move up toward $45 or even $50 may not be a farfetched idea at all. |
| Graphic provided by: MetaStock. |
| |
| Saucer patterns aren't the most common occurrences, but they can help provide some clues as to the overall technical state of a stock or commodity contract. The saucer pattern that has manifested on AEM's daily chart leaves little doubt as to the steady amount of accumulation that is under way in this major gold miner's stock. In a typical saucer pattern, there is an ever more gentle descent into the ultimate bottom, followed by an equally mellow, yet steadily rising trend up and out of the low point of the pattern. In this case we also find that AEM's 34-period Chaikin money flow (CMF)(34) is also confirming this steady uptrend of accumulation as well, meaning that at least some amount of smart money is continuing to find a home in shares of AEM. It's interesting to note that the saucer pattern and the 200-day exponential moving average (EMA) are also beginning to converge and that the EMA is also starting to flatten out. A daily close above the 200-day EMA would send a powerful signal to traders and investors that AEM's uptrend and momentum are once again a force to be reckoned within the precious metals mining stocks. AEM's current dividend rate is 1.90%, far exceeding the money market rate at most banks, and that might also provide some extra incentive for longer-term investors to stay the course during AEM's rise up from the saucer bottom. While no one knows for sure which way the price of gold will go in the days and weeks ahead, it's still a fairly safe bet to stick with the precious metals stocks that are showing favorable trend, momentum, and money flow characteristics. AEM certainly is at or near the top of that list, and by using covered call trades, a trader/investor can help make the most out of AEM's near-term technical situation. The July $40 calls are going for about $2.40 now, allowing more than five weeks of time value until expiry on July 12, 2012. Liquidity in this strike is good, with a close bid/ask spread and decent open interest and daily volume figures. |

|
| FIGURE 2: GOLD MINING STOCKS. The 10 gold mining stocks with the strongest relative strength against the Market Vectors Gold Miners ETF over the past 13 weeks. |
| Graphic provided by: MetaStock. |
| Graphic provided by: MetaStock Explorer. |
| |
| More aggressive, adventurous risk-takers could even consider selling a July $35 put, which is currently priced at about $0.85. Even the July $32.50 put is fetching a healthy premium of about $0.43 as of this writing. Covered call trading/investing isn't magic by any means, but it is a fairly low risk, conservative stock/option strategy that works best in strongly trending markets. If you can, with some success, consistently identify stocks with strongly bullish trends and solid money flow and relative strength characteristics, then you will have a much greater chance of success as you set out to actually trade and then profit from them. |
Donald W. Pendergast is a financial markets consultant who offers specialized services to stock brokers and high net worth individuals who seek a better bottom line for their portfolios.
| Title: | Writer, market consultant |
| Company: | Linear Trading Systems LLC |
| Jacksonville, FL 32217 | |
| Phone # for sales: | 904-239-9564 |
| E-mail address: | lineartradingsys@gmail.com |
Traders' Resource Links | |
| Linear Trading Systems LLC has not added any product or service information to TRADERS' RESOURCE. | |
Click here for more information about our publications!
Comments

Request Information From Our Sponsors
- VectorVest, Inc.
- Executive Premier Workshop
- One-Day Options Course
- OptionsPro
- Retirement Income Workshop
- Sure-Fire Trading Systems (VectorVest, Inc.)
- Trading as a Business Workshop
- VectorVest 7 EOD
- VectorVest 7 RealTime/IntraDay
- VectorVest AutoTester
- VectorVest Educational Services
- VectorVest OnLine
- VectorVest Options Analyzer
- VectorVest ProGraphics v6.0
- VectorVest ProTrader 7
- VectorVest RealTime Derby Tool
- VectorVest Simulator
- VectorVest Variator
- VectorVest Watchdog
- StockCharts.com, Inc.
- Candle Patterns
- Candlestick Charting Explained
- Intermarket Technical Analysis
- John Murphy on Chart Analysis
- John Murphy's Chart Pattern Recognition
- John Murphy's Market Message
- MurphyExplainsMarketAnalysis-Intermarket Analysis
- MurphyExplainsMarketAnalysis-Visual Analysis
- StockCharts.com
- Technical Analysis of the Financial Markets
- The Visual Investor
