HOT TOPICS LIST
- MACD
- Fibonacci
- RSI
- Gann
- ADXR
- Stochastics
- Volume
- Triangles
- Futures
- Cycles
- Volatility
- ZIGZAG
- MESA
- Retracement
- Aroon
INDICATORS LIST
LIST OF TOPICS
PRINT THIS ARTICLE
by Billy Williams
Trading inside bar patterns can be lucrative, but using them in combination with this key principle can open up huge trading opportunities.
Position: Hold
Billy Williams
Billy Williams has been trading the markets for 27 years, specializing in momentum trading with stocks and options.
PRINT THIS ARTICLE
TECHNICAL ANALYSIS
Inside Bar Patterns And The Sushi Roll
06/12/12 12:32:36 PMby Billy Williams
Trading inside bar patterns can be lucrative, but using them in combination with this key principle can open up huge trading opportunities.
Position: Hold
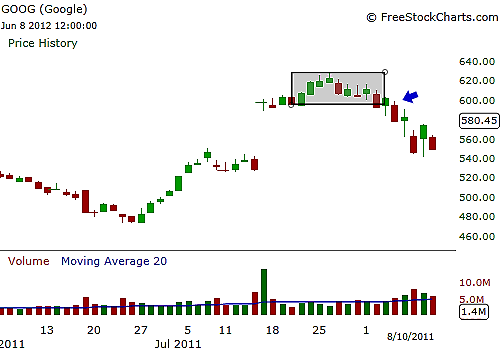
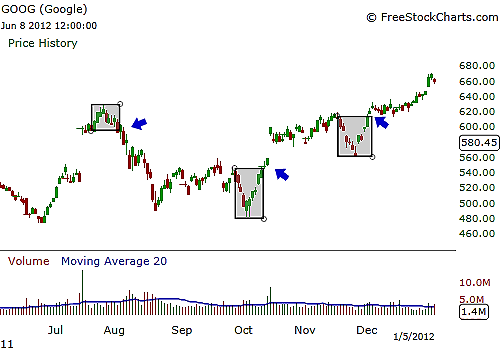
| When a stock or security has been in a sustained trend, inside bar patterns form where the high of the price bar is lower than the previous trading day and the low of the price bar is higher than the previous trading day as well. This is a kind of rest period for price before it resumes its primary initial trend or has a complete price reversal. The compelling thing about inside bar patterns is that they can also be combined and used collectively in some circumstances. At the individual level, inside bars can be used as a reliable method for trading any underlying instrument in the market, but they can also be used in combination to identify price reversals. See Figures 1 and 2. |

|
| FIGURE 1: GOOG. On July 15, 2011, Google experienced a big runaway gap, but soon after, a sushi roll formed and signaled a warning that a price reversal was under way. A short entry was signaled on August 2, 2011, as the previous five trading days engulfed the previous trading range of five trading days. |
| Graphic provided by: www.freestockcharts.com. |
| |
| Inside bars are symbolic of lower volatility and a transition into price contraction but they are also an indicator of a more widespread impact on price in this context. The reason for this is that during established price trends, new information could be introduced into the market that could affect sentiment on a given stock, for example. This impact could spread among the traders in the market and the former zeal that had been prevalent in a trending security could decline and take price movement with it. This can happen all at once or be spread out over several days but by taking a larger picture or macro-level view, you can use inside bar patterns to spot larger scale reversals at play. |

|
| FIGURE 2: GOOG. Later, on October, 11, 2011, and December 1, 2011, bullish signals were signaled as sushi roll patterns formed as Google began to climb higher in price from each entry point. |
| Graphic provided by: www.freestockcharts.com. |
| |
| One of these patterns are the "sushi roll" pattern. The sushi roll that was defined by Mark Fisher, trader and author of the book "The Logical Trader." One day over lunch, Fisher was discussing trade setups with his colleagues when he had an insight on combining narrow and wide price ranges. Later, he went on to use a period of 10 consecutive prices that were within a tight, narrow price range that formed a collective "inside pattern" with a second series of five price bars that engulfed the first series of price bars that created an "outside pattern" trading over the previous five bars' price range. Using this combination of inside and outside trading ranges can help you detect potential market reversals that you can trade for a profit or avoid unnecessary losses. A benefit of this pattern is that it signals a potential price reversal much sooner than a chart pattern like a double bottom or head & shoulders, for example. And it is applicable to any time frame, so it can be customized depending on your own trading preference. |
| It is important to note that the 10-price bar rule is not set in stone; what is important is the underlying principle that any price range that trades in a small trading range followed by a price range of equal length that engulfs the previous trading range can be an opportunity to profit in the market either by taking a position or preventing a loss. |
Billy Williams has been trading the markets for 27 years, specializing in momentum trading with stocks and options.
| Company: | StockOptionSystem.com |
| E-mail address: | stockoptionsystem.com@gmail.com |
Traders' Resource Links | |
| StockOptionSystem.com has not added any product or service information to TRADERS' RESOURCE. | |
Click here for more information about our publications!
Comments

Request Information From Our Sponsors
- StockCharts.com, Inc.
- Candle Patterns
- Candlestick Charting Explained
- Intermarket Technical Analysis
- John Murphy on Chart Analysis
- John Murphy's Chart Pattern Recognition
- John Murphy's Market Message
- MurphyExplainsMarketAnalysis-Intermarket Analysis
- MurphyExplainsMarketAnalysis-Visual Analysis
- StockCharts.com
- Technical Analysis of the Financial Markets
- The Visual Investor
- VectorVest, Inc.
- Executive Premier Workshop
- One-Day Options Course
- OptionsPro
- Retirement Income Workshop
- Sure-Fire Trading Systems (VectorVest, Inc.)
- Trading as a Business Workshop
- VectorVest 7 EOD
- VectorVest 7 RealTime/IntraDay
- VectorVest AutoTester
- VectorVest Educational Services
- VectorVest OnLine
- VectorVest Options Analyzer
- VectorVest ProGraphics v6.0
- VectorVest ProTrader 7
- VectorVest RealTime Derby Tool
- VectorVest Simulator
- VectorVest Variator
- VectorVest Watchdog
