HOT TOPICS LIST
- MACD
- Fibonacci
- RSI
- Gann
- ADXR
- Stochastics
- Volume
- Triangles
- Futures
- Cycles
- Volatility
- ZIGZAG
- MESA
- Retracement
- Aroon
INDICATORS LIST
LIST OF TOPICS
PRINT THIS ARTICLE
by Koos van der Merwe
The RSI divergence pattern is a pattern that strongly suggests the start of a bull run.
Position: Buy
Koos van der Merwe
Has been a technical analyst since 1969, and has worked as a futures and options trader with First Financial Futures in Johannesburg, South Africa.
PRINT THIS ARTICLE
RSI
That RSI Divergence
06/11/12 12:11:00 PMby Koos van der Merwe
The RSI divergence pattern is a pattern that strongly suggests the start of a bull run.
Position: Buy
| All technicians know what the relative strength index (RSI) is, and all technicians know how strong an RSI divergence pattern is in suggesting the start of a new bull run. So let us have a look at the three main US indexes. |

|
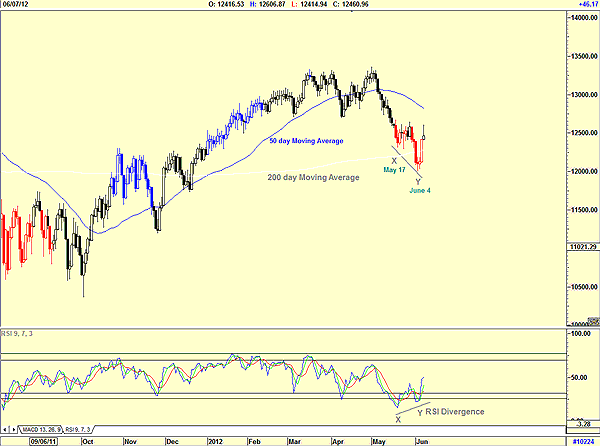
| FIGURE 1: DJIA |
| Graphic provided by: AdvancedGET. |
| |
| Figure 1 shows how the Dow Jones Industrial Average (DJIA) dropped below the 200-day moving average, a strong negative to those fundamental analysts who do not know much about technical analysts. At the same time, technicians would have looked at the low of May 17 and waited to see whether the RSI would stay above the low of X and give a strong divergence buy signal. As the DJIA bottomed on June 4, below the 200-day moving average, the RSI made a higher bottom of Y than the bottom of May 17, X, a very strong divergence buy. Technicians would have bought whatever the fundamental analysts sold at low prices. The DJIA responded by moving above the 200-day moving average, with the fundamental analysts shouting, "The DJIA found support on the 200-day moving average!" So who do you think was the winner? |

|
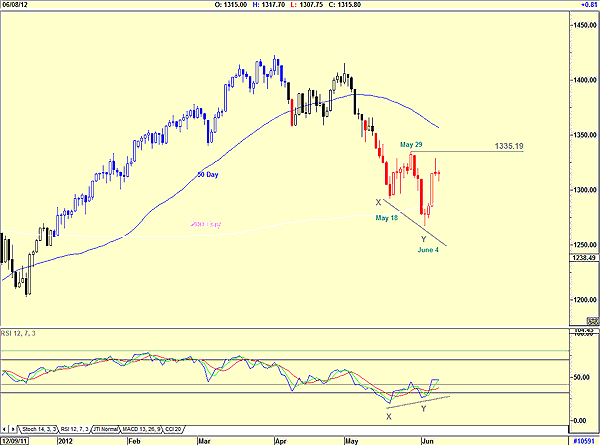
| FIGURE 2: S&P 500 |
| Graphic provided by: AdvancedGET. |
| |
| Figure 2 is the Standard & Poor's 500 daily chart and shows a similar pattern to that of the DJIA in Figure 1. The low at X, however, was May 18 and not May 17, as shown in Figure 1. Once again, the divergence between the index and the RSI is easily seen. Conservative investors can argue that they would like to see a break above the resistance at the 1335.19 pivot point of May 29, and I don't blame them. The market is nervous and scared. Caution is prevalent. |

|
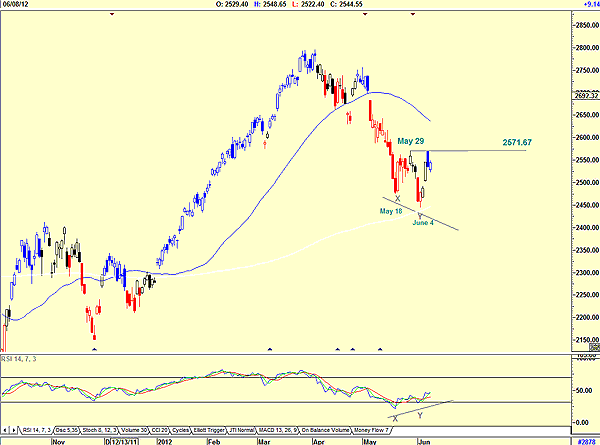
| FIGURE 3: NASDAQ, DAILY |
| Graphic provided by: AdvancedGET. |
| |
| Figure 3 is the NASDAQ 100 and shows the identical pattern to that of the DJIA in Figure 1 and the S&P 500 in Figure 2. The difference is that the NASDAQ did not fall below the 200-day moving average. The index also tested the resistance of the May 29th pivot point, suggesting that a move above this level will confirm the RSI divergence, giving a very strong buy signal. All the three major US indexes gave an RSI divergence buy signal on June 4. I would have been a buyer on June 5, looking for stocks that have given me an RSI divergence buy signal. |
Has been a technical analyst since 1969, and has worked as a futures and options trader with First Financial Futures in Johannesburg, South Africa.
| Address: | 3256 West 24th Ave |
| Vancouver, BC | |
| Phone # for sales: | 6042634214 |
| E-mail address: | petroosp@gmail.com |
Click here for more information about our publications!
Comments
Date: 06/14/12Rank: 4Comment:

Request Information From Our Sponsors
- StockCharts.com, Inc.
- Candle Patterns
- Candlestick Charting Explained
- Intermarket Technical Analysis
- John Murphy on Chart Analysis
- John Murphy's Chart Pattern Recognition
- John Murphy's Market Message
- MurphyExplainsMarketAnalysis-Intermarket Analysis
- MurphyExplainsMarketAnalysis-Visual Analysis
- StockCharts.com
- Technical Analysis of the Financial Markets
- The Visual Investor
- VectorVest, Inc.
- Executive Premier Workshop
- One-Day Options Course
- OptionsPro
- Retirement Income Workshop
- Sure-Fire Trading Systems (VectorVest, Inc.)
- Trading as a Business Workshop
- VectorVest 7 EOD
- VectorVest 7 RealTime/IntraDay
- VectorVest AutoTester
- VectorVest Educational Services
- VectorVest OnLine
- VectorVest Options Analyzer
- VectorVest ProGraphics v6.0
- VectorVest ProTrader 7
- VectorVest RealTime Derby Tool
- VectorVest Simulator
- VectorVest Variator
- VectorVest Watchdog
