HOT TOPICS LIST
- MACD
- Fibonacci
- RSI
- Gann
- ADXR
- Stochastics
- Volume
- Triangles
- Futures
- Cycles
- Volatility
- ZIGZAG
- MESA
- Retracement
- Aroon
INDICATORS LIST
LIST OF TOPICS
PRINT THIS ARTICLE
by Donald W. Pendergast, Jr.
A new daily RMO swing sell signal has just fired. Is this a low-risk shorting opportunity?
Position: N/A
Donald W. Pendergast, Jr.
Donald W. Pendergast is a financial markets consultant who offers specialized services to stock brokers and high net worth individuals who seek a better bottom line for their portfolios.
PRINT THIS ARTICLE
TRADING SYSTEMS
Is JNPR An Opportune Shorting Situation?
06/13/12 11:13:27 AMby Donald W. Pendergast, Jr.
A new daily RMO swing sell signal has just fired. Is this a low-risk shorting opportunity?
Position: N/A
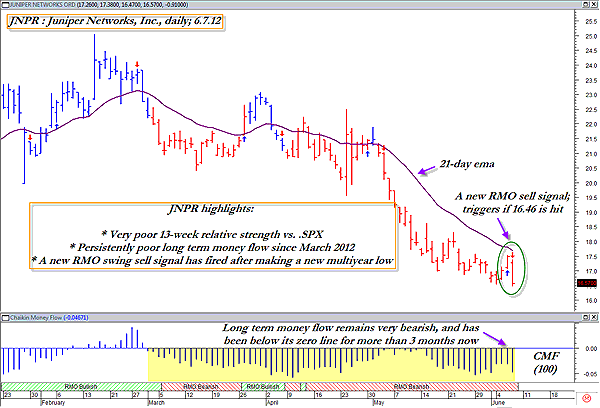
| Juniper Networks (JNPR) has been a familiar name among tech sector investors and traders since the late 1990s and has always been a stock that can be counted on to make tradable swing and/or trend-following moves from time to time, as its recent three-and-a-half month long selloff has clearly demonstrated. After making a multimonth cycle high of $25.04 on February 15, 2012, JNPR has been faltering, at first just chopping sideways and then plunging into a steady, near-linear decline almost six weeks ago. Now trading at $16.81, the stock is down nearly 35% since making that significant swing high in mid-February 2012, and although this has certainly got the attention of bottom-fishers and other value-oriented investors and traders, there remains substantial technical evidence that the stock may still have some more downside ahead before a truly attractive buying opportunity presents itself. Here's a look at JNPR's daily chart now (Figure 1). |

|
| FIGURE 1: JNPR, DAILY. Trading the short side can be tricky, but when a stock has persistently abysmal money flow and poor relative strength versus the .SPX, the risk of a short-covering rally may be lessened. |
| Graphic provided by: MetaStock. |
| Graphic provided by: RMO indicators from Metastock v.11. |
| |
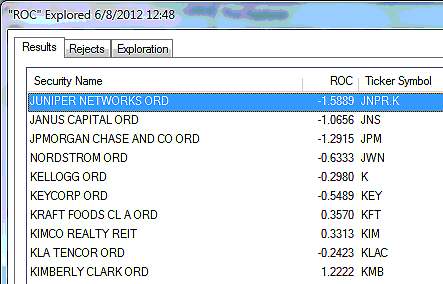
| Even a novice trader can discern that JNPR is enmeshed within the embrace of a major downtrend, one that actually appears to be strengthening. There are four major clues for us as traders and investors to consider: 1. Long-term money flow (based on the 100-period Chaikin money flow [CMF][100]) has consistently remained below its zero line for more than three months now. 2. JNPR has just made a fresh multiyear low, with several key price cycles still falling into what is anticipated to be a major low by the end of June or early July 2012. 3. JNPR has very poor comparative relative strength over the past 13 weeks versus the .SPX (Figure 2). 4. The Rahul Mohindar (RMO) trading system from MetaStock 11 has just issued a new swing sell signal, one that will be triggered on an intraday decline below $16.47. Now, of course, the broad US markets have rebounded a bit after enduring a very nasty May selloff, and it would be helpful to also see the .SPX breaking lower at the same time JNPR takes out $16.47 (if that even happens). We'll simply have to watch and see what happens should JNPR decide it wants to go even lower, with or without the participation of the broad markets. The only solid chart support level below $16.47 is the March 6, 2012, swing low of $12.43, and there is a real possibility that JNPR could fall that low, especially on a final, panic selling thrust that is frequently seen just prior to a major multicycle low being formed. |

|
| FIGURE 2: RELATIVE STRENGTH. JNPR's 13-week comparative relative strength versus the .SPX is very poor. |
| Graphic provided by: MetaStock. |
| Graphic provided by: MetaStock Explorer. |
| |
| Trading JNPR is simple, even though short selling is not necessarily a recommended trading strategy for less experienced traders. Simply place a sell-stop market order for $16.47, good till canceled, and if filled, start running a two-bar trailing stop of the daily highs until the stopout. With the cycles still in down mode, this might be a good time to let such a trade entry run without taking partial profits at any given chart support point. Since short-selling could be risky due to the potential for a short-covering rally, you may want to limit your account risk to perhaps only 1% on this or any other short trade. |
Donald W. Pendergast is a financial markets consultant who offers specialized services to stock brokers and high net worth individuals who seek a better bottom line for their portfolios.
| Title: | Writer, market consultant |
| Company: | Linear Trading Systems LLC |
| Jacksonville, FL 32217 | |
| Phone # for sales: | 904-239-9564 |
| E-mail address: | lineartradingsys@gmail.com |
Traders' Resource Links | |
| Linear Trading Systems LLC has not added any product or service information to TRADERS' RESOURCE. | |
Click here for more information about our publications!
Comments

Request Information From Our Sponsors
- StockCharts.com, Inc.
- Candle Patterns
- Candlestick Charting Explained
- Intermarket Technical Analysis
- John Murphy on Chart Analysis
- John Murphy's Chart Pattern Recognition
- John Murphy's Market Message
- MurphyExplainsMarketAnalysis-Intermarket Analysis
- MurphyExplainsMarketAnalysis-Visual Analysis
- StockCharts.com
- Technical Analysis of the Financial Markets
- The Visual Investor
- VectorVest, Inc.
- Executive Premier Workshop
- One-Day Options Course
- OptionsPro
- Retirement Income Workshop
- Sure-Fire Trading Systems (VectorVest, Inc.)
- Trading as a Business Workshop
- VectorVest 7 EOD
- VectorVest 7 RealTime/IntraDay
- VectorVest AutoTester
- VectorVest Educational Services
- VectorVest OnLine
- VectorVest Options Analyzer
- VectorVest ProGraphics v6.0
- VectorVest ProTrader 7
- VectorVest RealTime Derby Tool
- VectorVest Simulator
- VectorVest Variator
- VectorVest Watchdog
