HOT TOPICS LIST
- MACD
- Fibonacci
- RSI
- Gann
- ADXR
- Stochastics
- Volume
- Triangles
- Futures
- Cycles
- Volatility
- ZIGZAG
- MESA
- Retracement
- Aroon
INDICATORS LIST
LIST OF TOPICS
PRINT THIS ARTICLE
by Donald W. Pendergast, Jr.
Down by more than 40% from its mid-January 2012 high, shares of Apollo Group have begun a significant, bullish price reversal.
Position: N/A
Donald W. Pendergast, Jr.
Donald W. Pendergast is a financial markets consultant who offers specialized services to stock brokers and high net worth individuals who seek a better bottom line for their portfolios.
PRINT THIS ARTICLE
BREAKOUTS
Apollo Group Bullish Breakout After Support Test
06/12/12 12:16:44 PMby Donald W. Pendergast, Jr.
Down by more than 40% from its mid-January 2012 high, shares of Apollo Group have begun a significant, bullish price reversal.
Position: N/A
| Whenever a bearish trend persists, the sentiment surrounding a given stock can get so negative that even long-term holders of the stock can be tempted to throw in the proverbial towel. Aggressive short sellers can perhaps make money during such severe downturns, just as some have no doubt profited during Apollo Group's (APOL) latest four-month slide (with the stock being down as much as 48% at one point), but such traders are typically few and far between. For the rest of us, the best thing we can do is to be patient and wait for the market to offer us a reasonably low-risk buying opportunity. Well, that opportunity may already be here for APOL bulls, and here's a closer look (Figures 1 and 2). |

|
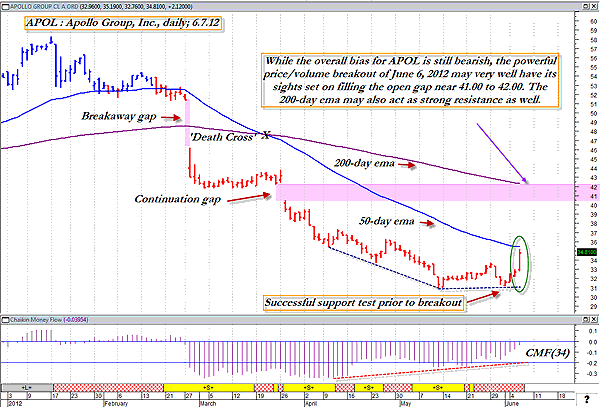
| FIGURE 1: APOL, DAILY. After a breakaway gap and continuation gap appear, most traders will be waiting for possible signs of an exhaustion gap to manifest. So far, there has been no sign of such a final gap. Will APOL be able to surge high enough in the near term to close the most recent open gap? |
| Graphic provided by: MetaStock. |
| Graphic provided by: CS Scientific expert from MetaStock 11. |
| |
| Obviously, the two open gaps are still the most prominent features on APOL's daily graph. The first one printed in late February 2012 and was an especially vicious decline; the second one happened a month later, after which the stock continued to deflate for another seven weeks. After making a major low on May 10, APOL managed to edge sideways for three weeks, even making a successful retest of the major low. Finally, we now see this convincing bullish breakout move print on the chart. Given that we've seen a retest of the May low and that money is really flowing quite well back into the stock (see the 34-period Chaikin money flow histogram [CMF][34]), as evidenced by the extremely bullish price/money flow divergence on the chart, the next job for traders who choose to go long on this setup is to determine the risk/reward parameters for the trade: 1. Using $40.75 as a logical, intial swing target for the trade and a hypothetical entry price of $35.20, our profit potential is about $5.25 per share. 2.If we use the low of the breakout bar -- minus one tick -- as our initial stop, which is $32.75, our risk on the trade is about $2.45 per share. 3. Taking our potential profit goal of $5.25 and dividing it by our projected risk of $2.45, we find that the reward/risk (RR) ratio for this trade is about 2.14 to 1. That's a very attractive RR for any trade, particularly for one manifesting the technical evidence already discussed. Given that the US broad markets are still in rebound mode, the best way to play a long entry on APOL here is to run a two- to three-bar trailing stop of the daily lows (but use the initial stop originally mentioned), attempting to hold on for a possible surge up to the area of the latest open gap ($40 to $41) or even the 200-period exponential moving average (EMA) (near $42). APOL certainly can trend for sustained periods, so there is no reason to doubt that this stock has the potential to run higher by $5, $6, or even $7 in the near term, especially if the broad markets also keep grinding higher. The economic landscape is as confusing and uncertain as it's ever been, and with so many dangerous economic crosscurrents at work in the markets, it's more important than ever to strictly limit the amount of risk to your account on your trades. For some traders, 2% is probably a good baseline figure to use, but when things are really crazy in the market (lots of whipsaws, fakeouts, bad earnings reports, economic meltdowns, corporate scandals, and so on), it makes perfect sense to drop that back down to 1%. Remember, a dollar saved is as good as, and in most cases, even better than a dollar earned, depending on your tax bracket, of course. |

|
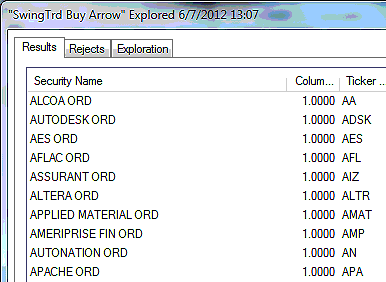
| FIGURE 2: LARGE-CAPS. There were dozens of large caps firing RMO swing buy signals on June 6, 2012. These are only 10 of those stocks. |
| Graphic provided by: MetaStock. |
| Graphic provided by: MetaStock Explorer. |
| |
Donald W. Pendergast is a financial markets consultant who offers specialized services to stock brokers and high net worth individuals who seek a better bottom line for their portfolios.
| Title: | Writer, market consultant |
| Company: | Linear Trading Systems LLC |
| Jacksonville, FL 32217 | |
| Phone # for sales: | 904-239-9564 |
| E-mail address: | lineartradingsys@gmail.com |
Traders' Resource Links | |
| Linear Trading Systems LLC has not added any product or service information to TRADERS' RESOURCE. | |
Click here for more information about our publications!
PRINT THIS ARTICLE

Request Information From Our Sponsors
- StockCharts.com, Inc.
- Candle Patterns
- Candlestick Charting Explained
- Intermarket Technical Analysis
- John Murphy on Chart Analysis
- John Murphy's Chart Pattern Recognition
- John Murphy's Market Message
- MurphyExplainsMarketAnalysis-Intermarket Analysis
- MurphyExplainsMarketAnalysis-Visual Analysis
- StockCharts.com
- Technical Analysis of the Financial Markets
- The Visual Investor
- VectorVest, Inc.
- Executive Premier Workshop
- One-Day Options Course
- OptionsPro
- Retirement Income Workshop
- Sure-Fire Trading Systems (VectorVest, Inc.)
- Trading as a Business Workshop
- VectorVest 7 EOD
- VectorVest 7 RealTime/IntraDay
- VectorVest AutoTester
- VectorVest Educational Services
- VectorVest OnLine
- VectorVest Options Analyzer
- VectorVest ProGraphics v6.0
- VectorVest ProTrader 7
- VectorVest RealTime Derby Tool
- VectorVest Simulator
- VectorVest Variator
- VectorVest Watchdog
