HOT TOPICS LIST
- MACD
- Fibonacci
- RSI
- Gann
- ADXR
- Stochastics
- Volume
- Triangles
- Futures
- Cycles
- Volatility
- ZIGZAG
- MESA
- Retracement
- Aroon
INDICATORS LIST
LIST OF TOPICS
PRINT THIS ARTICLE
by Donald W. Pendergast, Jr.
After making a major swing low in mid-May 2012, shares of Newmont Mining have begun to accelerate higher.
Position: N/A
Donald W. Pendergast, Jr.
Donald W. Pendergast is a financial markets consultant who offers specialized services to stock brokers and high net worth individuals who seek a better bottom line for their portfolios.
PRINT THIS ARTICLE
BREAKOUTS
Newmont Mining Price And Volume Breakout
06/11/12 09:28:54 AMby Donald W. Pendergast, Jr.
After making a major swing low in mid-May 2012, shares of Newmont Mining have begun to accelerate higher.
Position: N/A
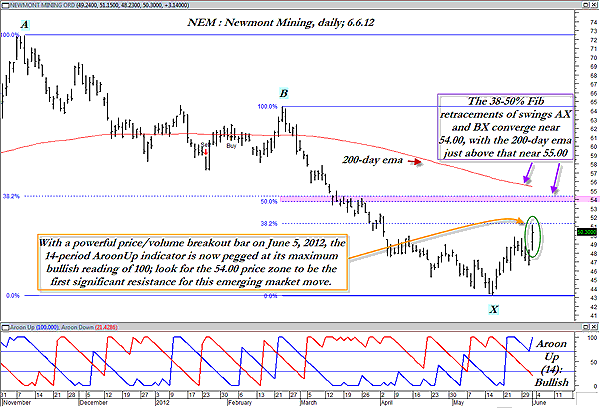
| As discussed in two of my more recent Traders.com Advantage pieces, Newmont Mining (NEM) had a major selloff between early November 2011 and May 2012, dropping by more than 40% at one point during that time window. While such large-scale moves aren't all that uncommon in large-cap gold stocks, for gold bulls, it must have been maddening to have to wait so long before a major multicycle low could form, thus offering a fresh low-risk buying opportunity for them to pounce on. Apparently, the bulls in NEM are getting impatient, what with the powerful price/volume breakout it enjoyed on June 5, 2012. NEM gained 6.65% on daily volume that was more than 70% higher than its 50-day moving average of volume -- a very big deal, and the daily chart of NEM makes this very clear. The stock is just shy of the Fibonacci 38% retracement of swing BX, so it would not be surprising to see that act as a moderate resistance level, but the price cycles in the stock are definitely in bullish mode for the time being. With the 14-period AroonUp indicator now pegged at 100 (its maximum bullish reading), this would also appear to confirm the notion that NEM may have some more upside before a minor correction ensues. See Figures 1 and 2. |

|
| FIGURE 1: NEM, DAILY. While this bullish price/volume breakout in NEM looks very impressive, bear in mind that both the long- and medium-term money flows for the stock are in bearish territory. Any fast rise up toward 54.00 should be viewed as a "take full profts" signal for NEM longs. |
| Graphic provided by: MetaStock. |
| |
| If there is one fly in the ointment in NEM's technical picture, it's this: both the 34- and 100-period Chaikin money flows ([CMF][34] and [CMF][100]) are in bearish territory, and if a major rally/retracement of the recent major losses is to occur, then the money flow trend needs to start ramping up, and soon. That's why if you see NEM quickly follow through and make a run for the 54.00 area, you should expect to see very significant resistance begin to manifest there. That's the pink shaded horizontal line on the chart, and it shows us where the 38 and 50% Fibonacci retracements of both swing AX and BX converge; this will be a major resistance area that serious traders will take note of, along with the stock's 200-day exponential moving average (EMA), which is currently just above 55.00. |

|
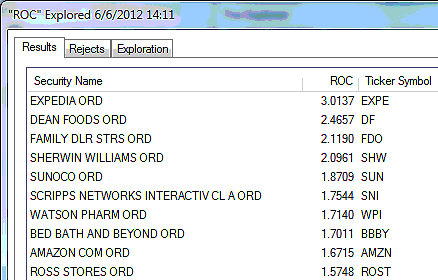
| FIGURE 2: LARGE-CAPS. Here are 10 large caps that are outperforming the .SPX over the past calendar quarter. |
| Graphic provided by: MetaStock. |
| Graphic provided by: MetaStock Explorer. |
| |
| NEM is currently outperforming the .SPX over the past 13 weeks so that is a bullish technical dynamic to be aware of, but again, the lack of money flow strength would seem to favor traders with a very short-term outlook: 1. Intraday scalpers 2. Intraday swing traders (using a 30- to 60-minute time frame) 3. Put sellers who believe that the recent swing low is going to hold for a while and are willing to settle for base-hit trading income rather than attempt to hold out for a trend-following equivalent of a grand slam. Traders going this route might want to check out the July 2012 42.50 and 40.00 puts to see if selling these would offer a good risk/reward ratio for their particular trading style. |
| The broad US markets are beginning to catch a bid again, and it would not be surprising to see them generally rise for the next five to seven trading sessions before going on to make a major multicycle low later this month or in early July. NEM may very well go along for the ride and make a run for the 54.00 area before this swing finally peters out. If going long NEM here, make sure you know exactly where your profit target is, what your stop-loss/trailing stop will be (a two-bar trailing stop of the daily lows might be a wise idea here) and what your account risk is -- making sure to limit it to 1% or 2% maximum. |
Donald W. Pendergast is a financial markets consultant who offers specialized services to stock brokers and high net worth individuals who seek a better bottom line for their portfolios.
| Title: | Writer, market consultant |
| Company: | Linear Trading Systems LLC |
| Jacksonville, FL 32217 | |
| Phone # for sales: | 904-239-9564 |
| E-mail address: | lineartradingsys@gmail.com |
Traders' Resource Links | |
| Linear Trading Systems LLC has not added any product or service information to TRADERS' RESOURCE. | |
Click here for more information about our publications!
Comments

|

Request Information From Our Sponsors
- VectorVest, Inc.
- Executive Premier Workshop
- One-Day Options Course
- OptionsPro
- Retirement Income Workshop
- Sure-Fire Trading Systems (VectorVest, Inc.)
- Trading as a Business Workshop
- VectorVest 7 EOD
- VectorVest 7 RealTime/IntraDay
- VectorVest AutoTester
- VectorVest Educational Services
- VectorVest OnLine
- VectorVest Options Analyzer
- VectorVest ProGraphics v6.0
- VectorVest ProTrader 7
- VectorVest RealTime Derby Tool
- VectorVest Simulator
- VectorVest Variator
- VectorVest Watchdog
- StockCharts.com, Inc.
- Candle Patterns
- Candlestick Charting Explained
- Intermarket Technical Analysis
- John Murphy on Chart Analysis
- John Murphy's Chart Pattern Recognition
- John Murphy's Market Message
- MurphyExplainsMarketAnalysis-Intermarket Analysis
- MurphyExplainsMarketAnalysis-Visual Analysis
- StockCharts.com
- Technical Analysis of the Financial Markets
- The Visual Investor
