HOT TOPICS LIST
- MACD
- Fibonacci
- RSI
- Gann
- ADXR
- Stochastics
- Volume
- Triangles
- Futures
- Cycles
- Volatility
- ZIGZAG
- MESA
- Retracement
- Aroon
INDICATORS LIST
LIST OF TOPICS
PRINT THIS ARTICLE
by Matt Blackman
Housing stocks have seen some big moves since October 2011. Recently the index flashed a sell signal. Is the move over?
Position: Buy
Matt Blackman
Matt Blackman is a full-time technical and financial writer and trader. He produces corporate and financial newsletters, and assists clients in getting published in the mainstream media. He is the host of TradeSystemGuru.com. Matt has earned the Chartered Market Technician (CMT) designation. Find out what stocks and futures Matt is watching on Twitter at www.twitter.com/RatioTrade
PRINT THIS ARTICLE
HEAD & SHOULDERS
Has Housing Hit The Wall?
06/08/12 09:20:56 AMby Matt Blackman
Housing stocks have seen some big moves since October 2011. Recently the index flashed a sell signal. Is the move over?
Position: Buy
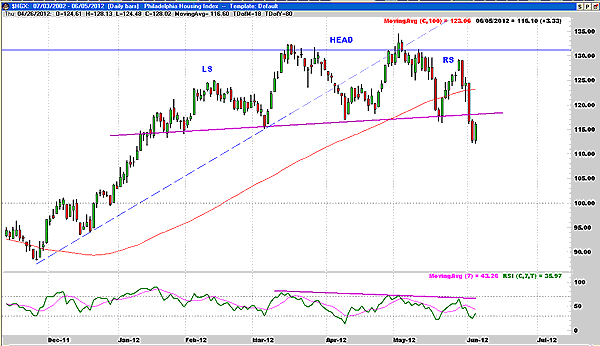
| Since October 2011, housing stocks have experienced a lift and companies such as Pulte Homes (PHM), Lennar Homes (LEN) and Beazer Homes (BZH) have enjoyed the ride. But a bearish head & shoulders pattern was confirmed on the Philadelphia Housing Index (HGX) during the first week of June 2012. Similarly bearish patterns have appeared on a number of builders' stocks, which are a stark reminder of chart patterns that signaled an end to the last housing bubble. In 2005, while house prices were rocketing into the stratosphere, the HGX flashed a bearish head & shoulders pattern that turned out to be the peak in the market (Figure 1). Over the next six years, both new and existing home prices got pummeled. |

|
| FIGURE 1: HGX, DAILY. The Philadelphia Housing Index shows the confirmed head & shoulders pattern. The minimum downside target arrived at by taking the distance from the peak of the head and neckline and subtracting it from the neckline from the downside neckline break is 100. |
| Graphic provided by: www.GenesisFT.com. |
| |
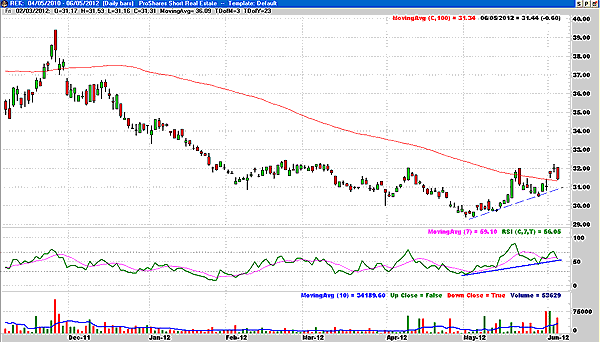
| So what do these latest bearish patterns mean? We certainly aren't in another bubble. But history has taught us that such patterns can't be ignored. The minimum downside target on the pattern on the HGX is around 100, a 30% drop from its latest peak. However, if the economy continues to weaken and worst case, we enter another recession. This will be just the first such move. As Figure 2 shows, the ProShares Short Real Estate ETF (REK) appears to have bottomed around 30, well off its 2010 high of 57. |

|
| FIGURE 2: REK. One of the housing exchange traded funds, the ProShares Short Real Estate ETF Rises when housing stocks fall. |
| Graphic provided by: www.GenesisFT.com. |
| |
| Those looking for a more aggressive way to play the real estate downside could try the ProShares Ultra Real Estate ETF (SRS) that moves up $2 for every $1 move in REK. Whatever method you decide to use to short the current real estate move, it pays to be cautious. Any upside breach of the HGX head & shoulders neckline on strong volume means that it may have failed and the bull has resumed. And a failure can be a powerful signal to switch sides. |
Matt Blackman is a full-time technical and financial writer and trader. He produces corporate and financial newsletters, and assists clients in getting published in the mainstream media. He is the host of TradeSystemGuru.com. Matt has earned the Chartered Market Technician (CMT) designation. Find out what stocks and futures Matt is watching on Twitter at www.twitter.com/RatioTrade
| Company: | TradeSystemGuru.com |
| Address: | Box 2589 |
| Garibaldi Highlands, BC Canada | |
| Phone # for sales: | 604-898-9069 |
| Fax: | 604-898-9069 |
| Website: | www.tradesystemguru.com |
| E-mail address: | indextradermb@gmail.com |
Traders' Resource Links | |
| TradeSystemGuru.com has not added any product or service information to TRADERS' RESOURCE. | |
Click here for more information about our publications!
PRINT THIS ARTICLE

Request Information From Our Sponsors
- StockCharts.com, Inc.
- Candle Patterns
- Candlestick Charting Explained
- Intermarket Technical Analysis
- John Murphy on Chart Analysis
- John Murphy's Chart Pattern Recognition
- John Murphy's Market Message
- MurphyExplainsMarketAnalysis-Intermarket Analysis
- MurphyExplainsMarketAnalysis-Visual Analysis
- StockCharts.com
- Technical Analysis of the Financial Markets
- The Visual Investor
- VectorVest, Inc.
- Executive Premier Workshop
- One-Day Options Course
- OptionsPro
- Retirement Income Workshop
- Sure-Fire Trading Systems (VectorVest, Inc.)
- Trading as a Business Workshop
- VectorVest 7 EOD
- VectorVest 7 RealTime/IntraDay
- VectorVest AutoTester
- VectorVest Educational Services
- VectorVest OnLine
- VectorVest Options Analyzer
- VectorVest ProGraphics v6.0
- VectorVest ProTrader 7
- VectorVest RealTime Derby Tool
- VectorVest Simulator
- VectorVest Variator
- VectorVest Watchdog
