HOT TOPICS LIST
- MACD
- Fibonacci
- RSI
- Gann
- ADXR
- Stochastics
- Volume
- Triangles
- Futures
- Cycles
- Volatility
- ZIGZAG
- MESA
- Retracement
- Aroon
INDICATORS LIST
LIST OF TOPICS
PRINT THIS ARTICLE
by Donald W. Pendergast, Jr.
Is Facebook, Inc., seen as "the IPO flop that continues to drop," or is it viewed by value investors as a solid long-term growth story?
Position: N/A
Donald W. Pendergast, Jr.
Donald W. Pendergast is a financial markets consultant who offers specialized services to stock brokers and high net worth individuals who seek a better bottom line for their portfolios.
PRINT THIS ARTICLE
TECHNICAL ANALYSIS
Facebook Intraday Bullish Money Flow Divergence
06/08/12 01:09:03 PMby Donald W. Pendergast, Jr.
Is Facebook, Inc., seen as "the IPO flop that continues to drop," or is it viewed by value investors as a solid long-term growth story?
Position: N/A
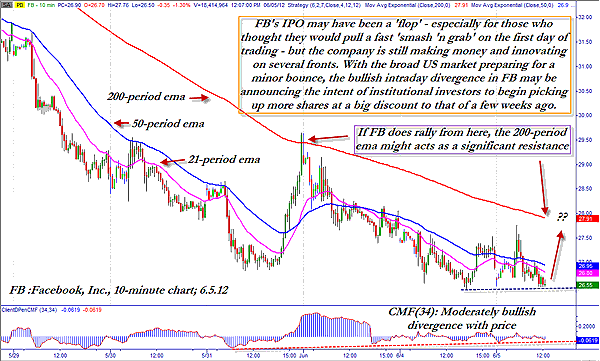
| Initial public offerings (IPOs) just ain't what they once were, especially in the heady Internet/dotcom craze era of 1995-99; perhaps the public finally figured out that if they positioned themselves well on the day of the IPO, they could pull a fast smash-and-grab operation, book some quick profits if the stock rose by 20% to 40% in the first few days of trading, and then head out of Dodge in a hurry before a full week's worth of trading was complete. Maybe the only way this sort of strategy works is if the majority of the IPO participants are long-term investors, thus allowing the shrewder and more savvy trading types to benefit from the built-in bullish bias this would provide for such a new issue, thus allowing them to count on a healthy, potentially profitable trade during the first week of the IPO. Alas, for the FB faithful, this just wasn't the case this time, with the stock only managing a minor rise after the open on May 18, 2012 -- going from $42.05 to $45 -- and closing at $38.35 at the close of the first day of trading. Overall, since May 18, 2012, the stock has been down for six of the nine days it's been trading and is now valued at $26.25 as I write this. That's a 35% haircut in a little over two weeks and could hardly be very heartening to these who were expecting to make a short-term profit in the shares. See Figures 1 and 2. |

|
| FIGURE 1: FB, 10-MINUTE. Although no one really knows where FB's initial swing low will appear, it does sometimes pay to watch intraday charts for signs of a possible divergence between money flow and price, which can be an early warning that a reversal may be due. |
| Graphic provided by: TradeStation. |
| |
| If we drill down to an intraday, 10-minute chart, however, we find that some interesting things are happening in FB: 1. A noticeable price/moneyflow divergence has manifested. 2. Volatility is lessening. 3. The spread between the 21- and 50-period exponential moving averges (EMA) is starting to converge, even as the distance between that pair of EMAs and the 200-period EMA has become more stable. Essentially, this intraday chart is suggesting that the worst of the initial selling panic in FB may be close to terminating and that value-conscious investors may now be stepping up to the plate, steadily accumulating shares. Before any real, sustainable trend reversal can occur on FB's 10-minute chart, however, we need to see a close above $26.75 and then $27.91, which is the current value of the 200-period EMA. FB's last mini-rally was turned back by this important EMA, and it's a safe bet that this average will also offer some more resistance the next time FB decides to burst higher. |

|
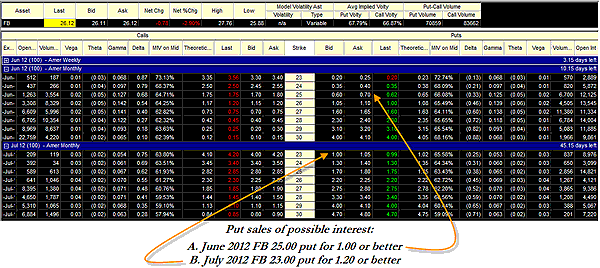
| FIGURE 2: FACEBOOK PUTS AND CALLS. FB puts and calls have excellent liquidity, with many strikes available. Note the heavy open interest in the June 2012 30.00 calls and the July 25.00 puts. |
| Graphic provided by: TradeStation. |
| |
| Playing FB here might involve nothing more complex than selling a June 25.00 put option for 1.00 or better; you might even consider a July 23.00 put if it hits 1.20 or better. If you like the idea of being assigned 100 shares of FB for every put you sell, then just sell the puts at those price (or better) and do nothing -- either you'll be assigned at expiration if the stock closes in the money, or you'll simple walk away free and clear, keeping all of the premiums collected for the puts at the time of sale. And even though the near-term price direction for FB is uncertain, you can at least be sure your trading account won't take too much of a hit if you decide upfront to limit your risk on any FB trades to no more than 2% of your account equity value. Playing a good defense is always your first job when considering any trade, in any financial instrument. |
Donald W. Pendergast is a financial markets consultant who offers specialized services to stock brokers and high net worth individuals who seek a better bottom line for their portfolios.
| Title: | Writer, market consultant |
| Company: | Linear Trading Systems LLC |
| Jacksonville, FL 32217 | |
| Phone # for sales: | 904-239-9564 |
| E-mail address: | lineartradingsys@gmail.com |
Traders' Resource Links | |
| Linear Trading Systems LLC has not added any product or service information to TRADERS' RESOURCE. | |
Click here for more information about our publications!
Comments

Request Information From Our Sponsors
- StockCharts.com, Inc.
- Candle Patterns
- Candlestick Charting Explained
- Intermarket Technical Analysis
- John Murphy on Chart Analysis
- John Murphy's Chart Pattern Recognition
- John Murphy's Market Message
- MurphyExplainsMarketAnalysis-Intermarket Analysis
- MurphyExplainsMarketAnalysis-Visual Analysis
- StockCharts.com
- Technical Analysis of the Financial Markets
- The Visual Investor
- VectorVest, Inc.
- Executive Premier Workshop
- One-Day Options Course
- OptionsPro
- Retirement Income Workshop
- Sure-Fire Trading Systems (VectorVest, Inc.)
- Trading as a Business Workshop
- VectorVest 7 EOD
- VectorVest 7 RealTime/IntraDay
- VectorVest AutoTester
- VectorVest Educational Services
- VectorVest OnLine
- VectorVest Options Analyzer
- VectorVest ProGraphics v6.0
- VectorVest ProTrader 7
- VectorVest RealTime Derby Tool
- VectorVest Simulator
- VectorVest Variator
- VectorVest Watchdog
