HOT TOPICS LIST
- MACD
- Fibonacci
- RSI
- Gann
- ADXR
- Stochastics
- Volume
- Triangles
- Futures
- Cycles
- Volatility
- ZIGZAG
- MESA
- Retracement
- Aroon
INDICATORS LIST
LIST OF TOPICS
PRINT THIS ARTICLE
by Donald W. Pendergast, Jr.
Down by more than 38% since late February 2012, shares of Hess Corp. may be approaching an area of Fibonacci support.
Position: N/A
Donald W. Pendergast, Jr.
Donald W. Pendergast is a financial markets consultant who offers specialized services to stock brokers and high net worth individuals who seek a better bottom line for their portfolios.
PRINT THIS ARTICLE
FIBONACCI
A Near-Term Bounce Due For HES?
06/07/12 02:25:04 PMby Donald W. Pendergast, Jr.
Down by more than 38% since late February 2012, shares of Hess Corp. may be approaching an area of Fibonacci support.
Position: N/A
| While the recent decline in gasoline prices is welcome news for motorists, for long-term shareholders of Hess Corp. (HES), the plunge in crude oil prices has dealt a nasty blow to the amount of open profits that they may have been counting on. However, the daily chart for HES suggests that a near-term bounce may be due sooner rather than later in this energy sector stock. Here's a closer look now (Figures 1 and 2). |

|
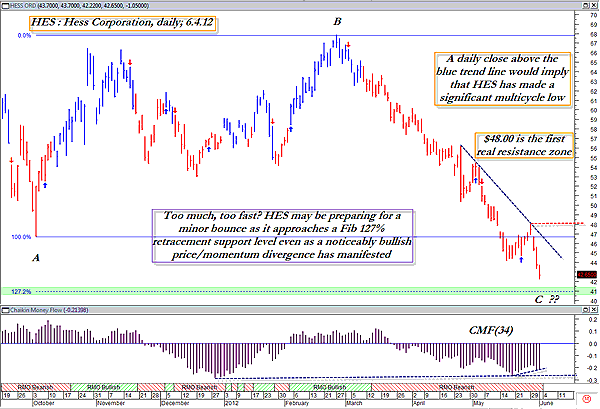
| FIGURE 1: HES, DAILY. While it will be impossible to know exactly when HES will make a significant low, if the stock can manage a daily close above the dashed blue trendline, it can at least be safely assumed that a multicycle of some magnitude has been achieved. |
| Graphic provided by: MetaStock. |
| Graphic provided by: RMO indicators from MetaStock 11. |
| |
| Figure 1 is overlaid with the Rahul Mohindar oscillator (RMO) trend on the daily price bars -- red for bearish trends and blue for bullish trends -- and it's easy to see that if you can manage to trade in the implied trend direction of the color bars, you can at times latch onto a powerful and potentially profitable trending move. A trader doing this would have gone short at about $62.85 on March 9, 2012, and would still be short as of this writing, nearly three months later, with HES now trading at about 42.10. And while it's usually unwise to second-guess a strong trending move, much less attempt to fade it (that is, take a position against the dominant trend, expecting a reversal opportunity), it's still a wise strategy to discern key areas of support and bullish momentum and/or money flow divergences that are beginning to combine to forecast an upcoming reversal scenario -- even as the price continues to fall. In this case, of course, we see the massive, 12-week downtrending move, one that at first glance still appears to be gathering bearish momentum. But then we also see that HES is closing in on a key Fibonacci retracement support zone, which is the 127.2% level (green shaded line). This is setting up even as HES is also manifesting a noticeable, bullish price/money flow divergence, one based on the 34-period Chaikin money flow [CMF][34] histogram; for the record, HES is also showing the same kind of divergence when measured with the 100-period CMF, too. So, while we may have identified a likely near-term reversal setup in HES, to make sure that a major multicycle low has formed, we need to see a daily close above the blue dashed trendline. At that time, it might be much safer to consider a long entry in HES, especially if you see an RMO swing buy arrow print around that time. |

|
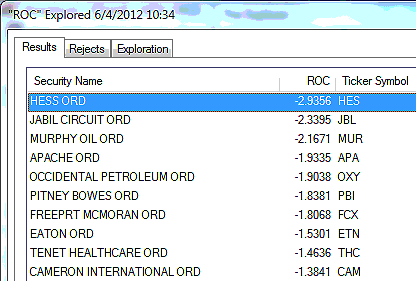
| FIGURE 2: LARGE-CAP UNDERPERFORMERS. Here are 10 large-cap stocks that have been significantly underperforming the .SPX over the past 13 weeks. |
| Graphic provided by: MetaStock. |
| Graphic provided by: MetaStock Explorer. |
| |
| For the here and now, adventurous traders might want to start pricing put options in HES, preferably those that are out of the money and have no more than three to six weeks until expiration. If you see HES make a quick surge down toward that Fibonacci 127.2% support level near $41, then you may want to start checking out the $37.50 and $35 strike puts, as these would offer you a bit of a buffer in case you don't nail the anticipated reversal dead-on. As always, limit your risk to any single trade to 1% to 2% maximum of your trading account value so if you're wrong on this particular trade, you can always come back and trade again, with minimal damage to your account. The broad US markets are expected to make another major multicycle low by late June or early July, so this is definitely one trade setup you'll want to watch for fresh developments over the next three to four weeks. |
Donald W. Pendergast is a financial markets consultant who offers specialized services to stock brokers and high net worth individuals who seek a better bottom line for their portfolios.
| Title: | Writer, market consultant |
| Company: | Linear Trading Systems LLC |
| Jacksonville, FL 32217 | |
| Phone # for sales: | 904-239-9564 |
| E-mail address: | lineartradingsys@gmail.com |
Traders' Resource Links | |
| Linear Trading Systems LLC has not added any product or service information to TRADERS' RESOURCE. | |
Click here for more information about our publications!
PRINT THIS ARTICLE

Request Information From Our Sponsors
- VectorVest, Inc.
- Executive Premier Workshop
- One-Day Options Course
- OptionsPro
- Retirement Income Workshop
- Sure-Fire Trading Systems (VectorVest, Inc.)
- Trading as a Business Workshop
- VectorVest 7 EOD
- VectorVest 7 RealTime/IntraDay
- VectorVest AutoTester
- VectorVest Educational Services
- VectorVest OnLine
- VectorVest Options Analyzer
- VectorVest ProGraphics v6.0
- VectorVest ProTrader 7
- VectorVest RealTime Derby Tool
- VectorVest Simulator
- VectorVest Variator
- VectorVest Watchdog
- StockCharts.com, Inc.
- Candle Patterns
- Candlestick Charting Explained
- Intermarket Technical Analysis
- John Murphy on Chart Analysis
- John Murphy's Chart Pattern Recognition
- John Murphy's Market Message
- MurphyExplainsMarketAnalysis-Intermarket Analysis
- MurphyExplainsMarketAnalysis-Visual Analysis
- StockCharts.com
- Technical Analysis of the Financial Markets
- The Visual Investor
