HOT TOPICS LIST
- MACD
- Fibonacci
- RSI
- Gann
- ADXR
- Stochastics
- Volume
- Triangles
- Futures
- Cycles
- Volatility
- ZIGZAG
- MESA
- Retracement
- Aroon
INDICATORS LIST
LIST OF TOPICS
PRINT THIS ARTICLE
by Andrew Hetherington
An early warning for Dollar General (DG) shows up in an ascending triangle and fan line formations.
Position: N/A
Andrew Hetherington
Classic Dow Theorist who trades as a pure technician, using pattern recognition.
PRINT THIS ARTICLE
CHART ANALYSIS
Ascending Triangles: The General Keeps on Marching
06/14/02 01:31:16 PMby Andrew Hetherington
An early warning for Dollar General (DG) shows up in an ascending triangle and fan line formations.
Position: N/A
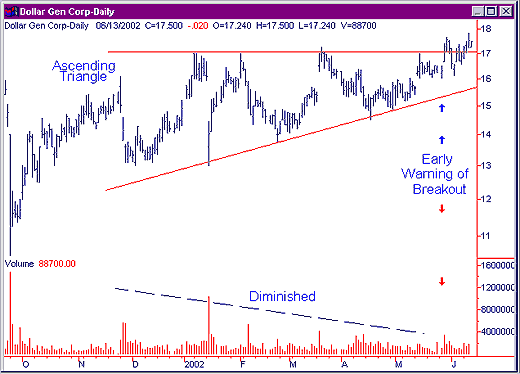
 Figure 1: A seven-month asecending triangle formation on Dollar General. Dollar General (DG) has been consolidating since 1998 and has bounced from $11.00 to $26.00 throughout this period. It formed a seven-month ascending triangle with diminished volume on the creation of the pattern. Although some would debate my upper line, it is correctly placed. This early warning that I've made reference to in many other articles is usually the result of anticipation of future events. These events include many potential developments, not the least of which is insider knowledge. I'm not suggesting that this chart has insider trading but that new developments and anticipation of those developments lead to this premature breakout. Much of this anticipation seems to be from the public trying to make successful investments. |

|
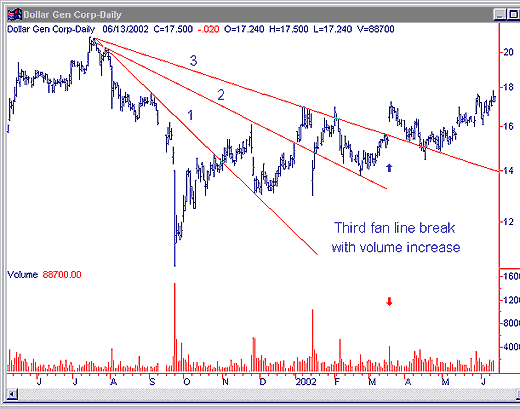
| Figure 2: Fan lines drawn from June 2001 to June 2002 for DG. |
| Graphic provided by: SuperCharts. |
| |
| This chart would have been more difficult to read with all the fan lines on it so I've drawn several daily charts to illustrate my fan lines. In figure 2, I've started my fan lines in June 2001. You can see the third fan line break on an increase in volume to change direction temporarily from down to up. I believe it is temporary because the fan lines are not an indication of a long-term trend. However, it has been my experience that following your fan lines will keep you headed in the right direction. I never take a position without good clear fan lines. |
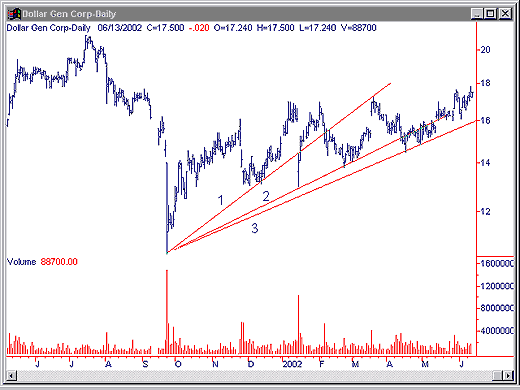
 Figure 3: Fan lines from September 2001 to June 2002 for DG. In figure 3, I've drawn my fan lines from the bottom in September 2001 to see if DG can hold its upward trend. You can clearly see that the third fan line has held strong and is currently at the $16.00 area. If this line breaks you would be forced to sell out your long position. |
| An upward move to a minimum of $21.00 eventually is likely and if it doesn't go higher than the top in June, 2001 at $21.00 then you should exit your long position since this resistance will be difficult to go through. |
Classic Dow Theorist who trades as a pure technician, using pattern recognition.
| Toronto, Canada |
Click here for more information about our publications!
Comments
Date: 06/18/02Rank: 5Comment:
Date: 06/19/02Rank: 5Comment:

|

Request Information From Our Sponsors
- StockCharts.com, Inc.
- Candle Patterns
- Candlestick Charting Explained
- Intermarket Technical Analysis
- John Murphy on Chart Analysis
- John Murphy's Chart Pattern Recognition
- John Murphy's Market Message
- MurphyExplainsMarketAnalysis-Intermarket Analysis
- MurphyExplainsMarketAnalysis-Visual Analysis
- StockCharts.com
- Technical Analysis of the Financial Markets
- The Visual Investor
- VectorVest, Inc.
- Executive Premier Workshop
- One-Day Options Course
- OptionsPro
- Retirement Income Workshop
- Sure-Fire Trading Systems (VectorVest, Inc.)
- Trading as a Business Workshop
- VectorVest 7 EOD
- VectorVest 7 RealTime/IntraDay
- VectorVest AutoTester
- VectorVest Educational Services
- VectorVest OnLine
- VectorVest Options Analyzer
- VectorVest ProGraphics v6.0
- VectorVest ProTrader 7
- VectorVest RealTime Derby Tool
- VectorVest Simulator
- VectorVest Variator
- VectorVest Watchdog
