HOT TOPICS LIST
- MACD
- Fibonacci
- RSI
- Gann
- ADXR
- Stochastics
- Volume
- Triangles
- Futures
- Cycles
- Volatility
- ZIGZAG
- MESA
- Retracement
- Aroon
INDICATORS LIST
LIST OF TOPICS
PRINT THIS ARTICLE
by Donald W. Pendergast, Jr.
After tracing out a well-formed consolidation pattern, will the new bullish breakout in shares of Forest Labs, Inc., lead to a continuation move?
Position: N/A
Donald W. Pendergast, Jr.
Donald W. Pendergast is a financial markets consultant who offers specialized services to stock brokers and high net worth individuals who seek a better bottom line for their portfolios.
PRINT THIS ARTICLE
TRADING SYSTEMS
Is FRX Setting Up For A Continuation Move?
06/06/12 08:31:27 AMby Donald W. Pendergast, Jr.
After tracing out a well-formed consolidation pattern, will the new bullish breakout in shares of Forest Labs, Inc., lead to a continuation move?
Position: N/A
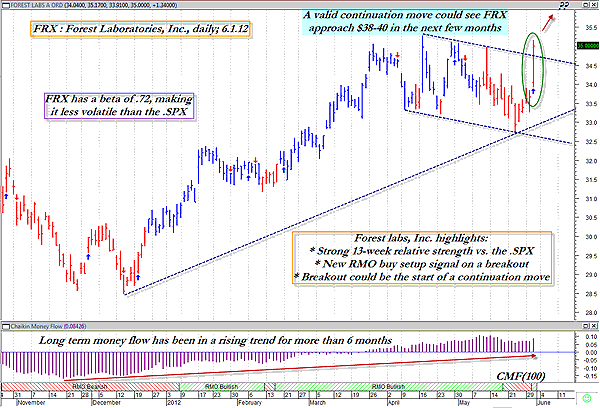
| Like many other stocks in the universe of Standard & Poor's 500 components, shares of Forest Labs (FRX) embarked on a sustained bullish trend move in mid- to late December 2011, one that lasted for a full four months. The stock managed to go from $28.47 all the way to $35.28 during that time (up by nearly 24%, not bad for a stock that had a beta of only 0.72 against the .SPX), finally peaking on April 17, 2012. The stock proceeded to forge a noticeable, flag-like consolidation period for the next six weeks and has now made a very strong bullish breakout move from the pattern. Here's a closer look at FRX's daily chart now (Figure 1). |

|
| FIGURE 1: FRX, DAILY. With such a long-running, long-term money flow trend in place, trading FRX with a long side bias appears to make good sense, especially since the stock has high relative strength vs the .SPX. |
| Graphic provided by: MetaStock. |
| Graphic provided by: RMO indicators from MetaStock 11. |
| |
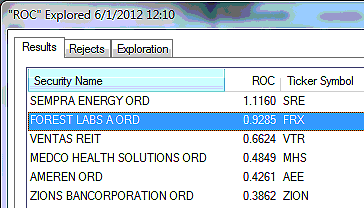
| FRX's price has held up pretty well, especially compared to the strong declines seen in the broad market indexes over the past six weeks, and this may help explain why money keeps on flowing into FRX at such a steady rate. Looking at the 100-period Chaikin money flow histogram (CMF)(100) at the bottom of the chart, we find that the long-term money flow trend has been rising since mid-November 2011 and it is now also well above its zero line. Apparently, big institutional investors like the idea of keeping at least some of their funds in a large-cap pharmaceutical stock like FRX, one that truly hails from one of the "buy or die" stock industry groups (think food, water, energy, health care, and so on, all of which represent must-have consumer staples in a modern society). FRX's 13-week comparative relative strength versus the .SPX is also very strong, which is another thing that momentum-based traders like to see when looking for low-risk entry points in a given stock. See Figure 2. |

|
| FIGURE 2: LARGE-CAP STOCKS. Six large caps that are outperforming the .SPX and are also firing RMO swing buy signals. |
| Graphic provided by: MetaStock. |
| Graphic provided by: MetaStock Explorer. |
| |
| "Flags fly at half-mast" is an old and somewhat reliable saying among older traders and technicians, and if this is to prove out in this current flag pattern breakout in FRX, it could imply that the stock has a chance at hitting a price target of $38 to $40 if the breakout can gather steam in the days and weeks ahead. The reasoning is something like this: the midpoint of the flag is approximately $33.80 per share and the price swing from mid-December to mid-April yielded a $6.81 gain. If we simply add $6.81 to $33.80, we arrive at a target potential price of $40.61 per share. Taking only 62% of that $6.81 swing length gives us $4.22; adding that to $33.80 yields in a potential target price of $38.02. These are simply potential price targets to work with and should not be viewed as the final word on where FRX's price is headed, as only the market itself can and will determine that. |
| If you believe that FRX is indeed another safe haven stock play (see my Traders.com Advantage article yesterday on Dean Foods), then you may want to adopt a near-term covered-call strategy where you buy a slightly in-the-money call option with three to six weeks of time value for every 100 shares of FRX you now own or are planning to buy. Running a nine-week exponential moving average (EMA) of the stock's weekly close can be one way of allowing the trade to back and fill somewhat, but without the risk of a premature stopout. In previous articles I have also mentioned that a 21-day EMA can also work quite well for high relative strength/high momentum covered-call setups like this one. Take some time, do your own homework, and see if you also don't agree that this looks like a very low-risk long trade setup in FRX. |
Donald W. Pendergast is a financial markets consultant who offers specialized services to stock brokers and high net worth individuals who seek a better bottom line for their portfolios.
| Title: | Writer, market consultant |
| Company: | Linear Trading Systems LLC |
| Jacksonville, FL 32217 | |
| Phone # for sales: | 904-239-9564 |
| E-mail address: | lineartradingsys@gmail.com |
Traders' Resource Links | |
| Linear Trading Systems LLC has not added any product or service information to TRADERS' RESOURCE. | |
Click here for more information about our publications!
Comments

Request Information From Our Sponsors
- StockCharts.com, Inc.
- Candle Patterns
- Candlestick Charting Explained
- Intermarket Technical Analysis
- John Murphy on Chart Analysis
- John Murphy's Chart Pattern Recognition
- John Murphy's Market Message
- MurphyExplainsMarketAnalysis-Intermarket Analysis
- MurphyExplainsMarketAnalysis-Visual Analysis
- StockCharts.com
- Technical Analysis of the Financial Markets
- The Visual Investor
- VectorVest, Inc.
- Executive Premier Workshop
- One-Day Options Course
- OptionsPro
- Retirement Income Workshop
- Sure-Fire Trading Systems (VectorVest, Inc.)
- Trading as a Business Workshop
- VectorVest 7 EOD
- VectorVest 7 RealTime/IntraDay
- VectorVest AutoTester
- VectorVest Educational Services
- VectorVest OnLine
- VectorVest Options Analyzer
- VectorVest ProGraphics v6.0
- VectorVest ProTrader 7
- VectorVest RealTime Derby Tool
- VectorVest Simulator
- VectorVest Variator
- VectorVest Watchdog
