HOT TOPICS LIST
- MACD
- Fibonacci
- RSI
- Gann
- ADXR
- Stochastics
- Volume
- Triangles
- Futures
- Cycles
- Volatility
- ZIGZAG
- MESA
- Retracement
- Aroon
INDICATORS LIST
LIST OF TOPICS
PRINT THIS ARTICLE
by Koos van der Merwe
Mad Money's Jim Cramer recently remarked that he liked three stocks.
Position: Buy
Koos van der Merwe
Has been a technical analyst since 1969, and has worked as a futures and options trader with First Financial Futures in Johannesburg, South Africa.
PRINT THIS ARTICLE
ELLIOTT WAVE
Mad Money's Cramer Likes
06/05/12 08:20:13 AMby Koos van der Merwe
Mad Money's Jim Cramer recently remarked that he liked three stocks.
Position: Buy
| I enjoy watching and listening to Jim Cramer on CNBC. He is clever; he is always giving an opinion, no matter how controversial, and he is always shouting, but he is definitely worth listening to. When he makes a mistake in his recommendations, he is also the first to admit to it, something that very few analysts do. Yesterday, in his "Mad Money" program, he told viewers that there were three companies that they should buy during the current market correction. Let us have a look at them. |

|
| FIGURE 1: AAPL, DAILY |
| Graphic provided by: AdvancedGET. |
| |
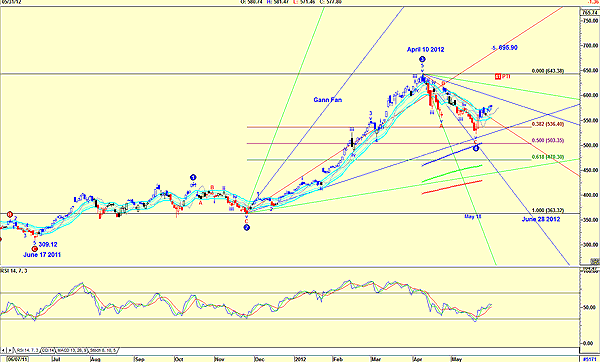
| Figure 1 is a daily chart of Apple Inc. (AAPL). The chart shows how the price rose from a low of $309.12 on June 17, 2011, to a high of $643.38 by April 10, 2012. An Elliott wave count suggests that the share price is currently in a wave 5 bull market that will see the price rise to $695.90. The PTI at 41 is suggesting a probability of 41% that this could occur. The Gann fans gave May 18 as the end of the fourth-wave correction. This proved correct, and the share price reversed on that date. The Gann fan is calling June 28 as a date to watch, probably the top of wave 1 of wave 5. Note how the wave 4 correction occurred on the 38.2% Fibonacci correction. The relative strength index (RSI) has given a buy signal; I would be a buyer of Apple at the present price with a target of $695.90. |

|
| FIGURE 2: WFC, DAILY |
| Graphic provided by: AdvancedGET. |
| |
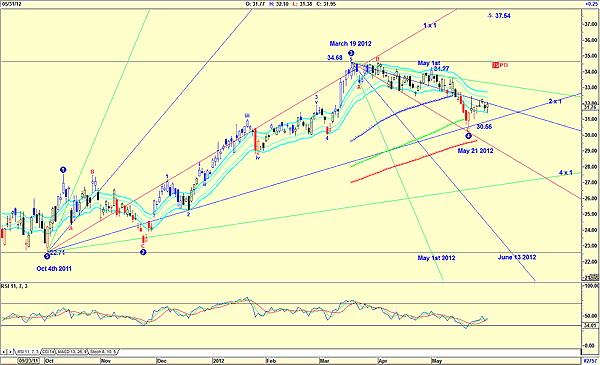
| The second company that Cramer likes is Wells Fargo (WFC). In Figure 2, I show how the share price rose from a low of $22.721 in October 4, 2011, to a high of $34.58 by March 19, 2012. From that high it has fallen in an Elliott wave fourth-wave correction to a low of $30.56 by May 21, 2012, finding support on the 2x1 Gann fan line. The PTI is suggesting a 75% probability of the share price rising to $37.54, with the Gann fan suggesting a date of June 13, 2012. The Gann fan was accurate in calling the May 1st high of $34.27, but it did not call the fourth-wave low of May 21. Nevertheless, we will keep this date in mind. Do note the JM internal band indicator is not suggesting a buy signal, but the RSI is. Remember that the JM internal band indicator is a conservative indicator, and investors could use this indicator to confirm a buy signal. |

|
| FIGURE 3: VZ, DAILY |
| Graphic provided by: AdvancedGET. |
| |
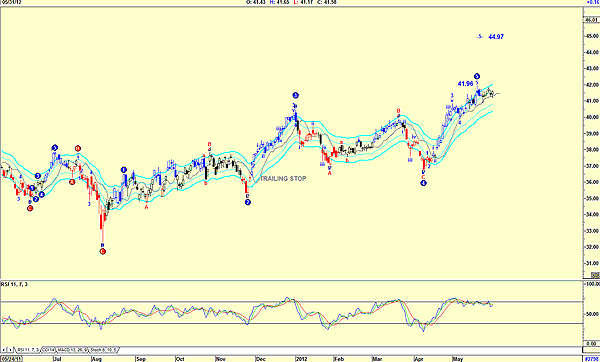
| The third company Cramer likes is Verizon (VZ). Figure 3 has an Elliott wave count that is suggesting a wave 5 top is complete, with the possibility that the share price could rise to $44.97. There is no PTI, which means that the custom-built Elliott wave count believes that $41.96 is the wave 5 top. This is confirmed by the RSI, which is in sell mode. I have included a trailing stop indicator and the share price is still above this indicator, so a sell has not yet been given. The trailing stop is a six-period moving average of the close of four days ago. Looking at the chart, one can see how effective it was. I would be a buyer of Apple and of Wells Fargo, but I would not be a buyer of Verizon. Jim Cramer, you are correct two times out of three. Not bad. |
Has been a technical analyst since 1969, and has worked as a futures and options trader with First Financial Futures in Johannesburg, South Africa.
| Address: | 3256 West 24th Ave |
| Vancouver, BC | |
| Phone # for sales: | 6042634214 |
| E-mail address: | petroosp@gmail.com |
Click here for more information about our publications!
PRINT THIS ARTICLE

Request Information From Our Sponsors
- StockCharts.com, Inc.
- Candle Patterns
- Candlestick Charting Explained
- Intermarket Technical Analysis
- John Murphy on Chart Analysis
- John Murphy's Chart Pattern Recognition
- John Murphy's Market Message
- MurphyExplainsMarketAnalysis-Intermarket Analysis
- MurphyExplainsMarketAnalysis-Visual Analysis
- StockCharts.com
- Technical Analysis of the Financial Markets
- The Visual Investor
- VectorVest, Inc.
- Executive Premier Workshop
- One-Day Options Course
- OptionsPro
- Retirement Income Workshop
- Sure-Fire Trading Systems (VectorVest, Inc.)
- Trading as a Business Workshop
- VectorVest 7 EOD
- VectorVest 7 RealTime/IntraDay
- VectorVest AutoTester
- VectorVest Educational Services
- VectorVest OnLine
- VectorVest Options Analyzer
- VectorVest ProGraphics v6.0
- VectorVest ProTrader 7
- VectorVest RealTime Derby Tool
- VectorVest Simulator
- VectorVest Variator
- VectorVest Watchdog
