HOT TOPICS LIST
- MACD
- Fibonacci
- RSI
- Gann
- ADXR
- Stochastics
- Volume
- Triangles
- Futures
- Cycles
- Volatility
- ZIGZAG
- MESA
- Retracement
- Aroon
INDICATORS LIST
LIST OF TOPICS
PRINT THIS ARTICLE
by Matt Blackman
The Facebook (FB) initial public offering (IPO) was launched with a broad range of opinions. Some (mostly the underwriters and promoters) loved it and analysts for the most part hated it. After a disastrous two weeks, where is the stock headed from here?
Position: Sell
Matt Blackman
Matt Blackman is a full-time technical and financial writer and trader. He produces corporate and financial newsletters, and assists clients in getting published in the mainstream media. He is the host of TradeSystemGuru.com. Matt has earned the Chartered Market Technician (CMT) designation. Find out what stocks and futures Matt is watching on Twitter at www.twitter.com/RatioTrade
PRINT THIS ARTICLE
VOLUME
Is Facebook Disaster Or Opportunity?
06/04/12 09:21:45 AMby Matt Blackman
The Facebook (FB) initial public offering (IPO) was launched with a broad range of opinions. Some (mostly the underwriters and promoters) loved it and analysts for the most part hated it. After a disastrous two weeks, where is the stock headed from here?
Position: Sell
| On May 18, 2012, the much-hyped Facebook IPO was launched with as much pomp and ceremony as the company and the stock's underwriters could muster. But even before the opening bell, analysts were skeptical. Paul Kedrosky, author of the "Infectious Greed" blog, opined in a May 18th Bloomberg interview that he (as a retail trader) was able to buy the IPO, which he found somewhat unusual. According to Bloomberg, only 15% of the IPO was designated to retail investors and the remaining 85% went to institutions. |

|
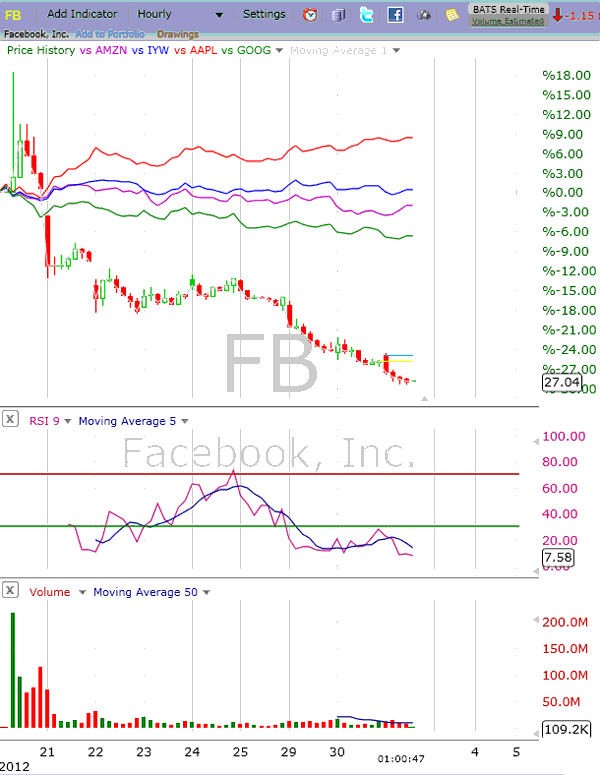
| FIGURE 1: FB, HOURLY. This chart showing the first nine trading days of Facebook compared to the Dow Jones US Technology Sector ETF (IYW), Amazon (AMZN), Apple (AAPL), and Google (GOOG). |
| Graphic provided by: FreeStockCharts.com. |
| |
| "If this thing trades below $38, egg [on the faces of promoters and underwriters] is not a strong-enough word. It would be a huge headline," Kedrosky commented on the day of the launch in what turned out to be the prophetic comment of the month. A $38 share price valued the company at $115 billion, which as one commentator commented was nearly 100 times current earnings. But drop it did and how such that by May 31, Facebook had lost approximately $32 billion in market cap, a drop of about 30%. As Figure 1 shows Facebook has been the submarine performer compared to its technology contemporaries such as Apple, Amazon, and Google. It is also interesting to note that over the period, the Dow Jones US Technology ETF (IYW) dropped approximately 7%, but it appears to be flat in Figure 1. |

|
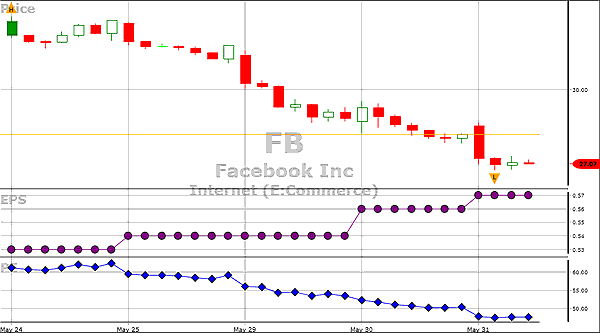
| FIGURE 2: FB, HOURLY. Hourly chart showing the first nine trading days together with forecasted earnings per share in purple (EPS) and forecasted price/earnings ratio in blue (PE). |
| Graphic provided by: VectorVest.com. |
| |
| Even after a 30% drop, the stock is still richly priced with forecasted earnings per share (EPS) at $0.57 a share -- the stock at $27 a share is still priced at more than 47 times expected earnings. It is clear in retrospect that the IPO sucked every dollar it could at $38 and underwriters will have their work cut out for them dealing with disgruntled shareholders, most of whom are institutions. Technically speaking, there are no signs of a bottoming process in Figure 2; volume has continued to fall but was still north of $42 million on May 31, the stock continues to put in a series of lower highs and lower lows, and although in oversold territory, the relative strength index (RSI) was still plumbing lower. |
| It has been this author's experience that fundamentals seriously lag stock price performance, so expect the stock to tell us, long before earnings or revenues pick up, when the bottom has been put in. This bottom could come in two forms. First, there's a capitulation bottom in which selling volume spikes as selling is exhausted and buyers step in. The second option would be more painful -- selling continuing to drop as selling slowly gets exhausted over a more protracted period before buyers decide the bloodletting is over and begin to pick away at the stock. At this point, this option is looking more likely. Institutions, once burned, will be shy about stepping up to the plate to buy the stock again and retail clients are probably feeling the same way. |
| Any sentiment change will be accompanied by an increase in buying volume and a series of higher lows and higher highs, but beware of those nasty fakeups. |
Matt Blackman is a full-time technical and financial writer and trader. He produces corporate and financial newsletters, and assists clients in getting published in the mainstream media. He is the host of TradeSystemGuru.com. Matt has earned the Chartered Market Technician (CMT) designation. Find out what stocks and futures Matt is watching on Twitter at www.twitter.com/RatioTrade
| Company: | TradeSystemGuru.com |
| Address: | Box 2589 |
| Garibaldi Highlands, BC Canada | |
| Phone # for sales: | 604-898-9069 |
| Fax: | 604-898-9069 |
| Website: | www.tradesystemguru.com |
| E-mail address: | indextradermb@gmail.com |
Traders' Resource Links | |
| TradeSystemGuru.com has not added any product or service information to TRADERS' RESOURCE. | |
Click here for more information about our publications!
PRINT THIS ARTICLE

|

Request Information From Our Sponsors
- VectorVest, Inc.
- Executive Premier Workshop
- One-Day Options Course
- OptionsPro
- Retirement Income Workshop
- Sure-Fire Trading Systems (VectorVest, Inc.)
- Trading as a Business Workshop
- VectorVest 7 EOD
- VectorVest 7 RealTime/IntraDay
- VectorVest AutoTester
- VectorVest Educational Services
- VectorVest OnLine
- VectorVest Options Analyzer
- VectorVest ProGraphics v6.0
- VectorVest ProTrader 7
- VectorVest RealTime Derby Tool
- VectorVest Simulator
- VectorVest Variator
- VectorVest Watchdog
- StockCharts.com, Inc.
- Candle Patterns
- Candlestick Charting Explained
- Intermarket Technical Analysis
- John Murphy on Chart Analysis
- John Murphy's Chart Pattern Recognition
- John Murphy's Market Message
- MurphyExplainsMarketAnalysis-Intermarket Analysis
- MurphyExplainsMarketAnalysis-Visual Analysis
- StockCharts.com
- Technical Analysis of the Financial Markets
- The Visual Investor
