HOT TOPICS LIST
- MACD
- Fibonacci
- RSI
- Gann
- ADXR
- Stochastics
- Volume
- Triangles
- Futures
- Cycles
- Volatility
- ZIGZAG
- MESA
- Retracement
- Aroon
INDICATORS LIST
LIST OF TOPICS
PRINT THIS ARTICLE
by Donald W. Pendergast, Jr.
Will shares of BMC Software follow through, rising in the wake of a successful test of gap support?
Position: N/A
Donald W. Pendergast, Jr.
Donald W. Pendergast is a financial markets consultant who offers specialized services to stock brokers and high net worth individuals who seek a better bottom line for their portfolios.
PRINT THIS ARTICLE
GAPS
With BMC Software, Successful Test Of Gap Support
06/01/12 08:17:08 AMby Donald W. Pendergast, Jr.
Will shares of BMC Software follow through, rising in the wake of a successful test of gap support?
Position: N/A
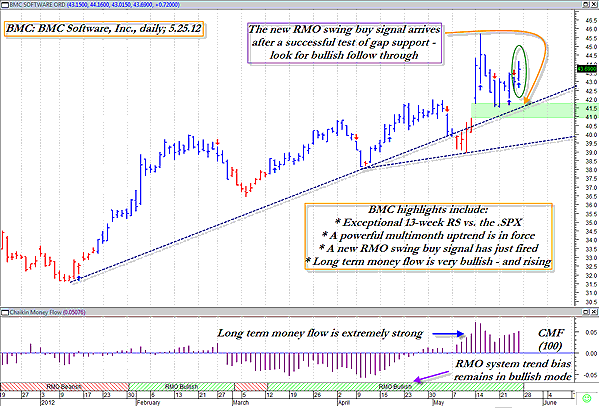
| After bottoming out and turning higher in mid-January 2012, shares of BMC Software (BMC) enjoyed a nearly 45% bullish advance by May 15, 2012. After making that near-term cycle high, the stock proceeded to pull back. In the process of doing so, it staged a successful test of the large open gap preceding the runup to the cycle high at 45.70. The big question now is this: Will the new buy signal for BMC generate enough buying enthusiasm to propel this large-cap tech issue to new multimonth highs? Here's a closer look now. See Figures 1 and 2. |

|
| FIGURE 1: BMC, DAILY. Technically speaking, there isn't much on this daily chart to make bulls in BMC unhappy. Money flow, trend momentum, and relative strength rankings of the stock are all very strong. |
| Graphic provided by: MetaStock. |
| Graphic provided by: RMO indicators from MetaStock 11. |
| |
| The tech sector stocks have staged several nice rebound rallies since the megamarket low of March 2009, and BMC has also enjoyed its share of bullish advances since then (along with some truly horrific periods and panic and selloff, too). For a large-cap stock, it trends very well at times and can sometimes buck the broad market trend direction of the industry group it resides in (the application software group); the stock also has great liquidity and a variety of option strikes and expirations available. Clearly, the stock is in a major, persistent uptrend, one that the recent bullish continuation gap certainly gave its seal of approval to. Long-term money flow in BMC (depicted by the Chaikin money flow histogram [CMF][100]) is exceptionally strong and is actually rising; traders and investors are obviously enthused after knowing that such a major test of support has led to the recent rise out of the pullback. BMC also features strong comparative relative strength versus the .SPX over the last 13 weeks, yet another factor that bulls in this stock will appreciate. |

|
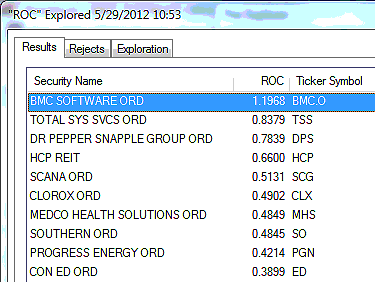
| FIGURE 2: ROC RESULTS. The top 10 large-cap stocks firing RMO swing buy signals that are also outperforming the .SPX over the last 13 weeks. |
| Graphic provided by: MetaStock. |
| Graphic provided by: MetaStock Explorer. |
| |
| The RMO (Rahul Mohindar) swing buy signal looks interesting at this juncture, given the bullish trend, money flow, and gap support factors already mentioned, and if the broad market can continue in rally mode for the next few sessions, it would not be surprising to see BMC rise up to the recent swing high of 45.70, if not surpass it. Playing this long setup in BMC is fairly simple: 1. Buy on a break above 44.16 2. Start running a two-bar trail of the daily lows 3. Either take partial profits if 45.70 is hit or just let the entire position run until final closeout, adjusting the stop every day. More conservative traders might want to also investigate using a covered call (CC) on BMC, given its strong relative strength ranking, but with the broad market now technically in a bear market rally that might actually be more adventurous a trade than the stock-only swing trade setup already mentioned. If you do go this route, be sure to use a sensible trailing stop (perhaps a 20-day exponential moving average (EMA) as your stop-loss line and use calls with only three to six weeks of time value remaining. Bid-ask spreads are very good on BMC calls and puts, so you should have little trouble finding a suitable CC setup to pursue here in BMC. Whether playing BMC as a straight stock trade or as a covered-call deal, be sure to limit the risk to your account to no more than 1% to 2% of its value, just in case the trades don't pan out as anticipated. |
Donald W. Pendergast is a financial markets consultant who offers specialized services to stock brokers and high net worth individuals who seek a better bottom line for their portfolios.
| Title: | Writer, market consultant |
| Company: | Linear Trading Systems LLC |
| Jacksonville, FL 32217 | |
| Phone # for sales: | 904-239-9564 |
| E-mail address: | lineartradingsys@gmail.com |
Traders' Resource Links | |
| Linear Trading Systems LLC has not added any product or service information to TRADERS' RESOURCE. | |
Click here for more information about our publications!
PRINT THIS ARTICLE

Request Information From Our Sponsors
- VectorVest, Inc.
- Executive Premier Workshop
- One-Day Options Course
- OptionsPro
- Retirement Income Workshop
- Sure-Fire Trading Systems (VectorVest, Inc.)
- Trading as a Business Workshop
- VectorVest 7 EOD
- VectorVest 7 RealTime/IntraDay
- VectorVest AutoTester
- VectorVest Educational Services
- VectorVest OnLine
- VectorVest Options Analyzer
- VectorVest ProGraphics v6.0
- VectorVest ProTrader 7
- VectorVest RealTime Derby Tool
- VectorVest Simulator
- VectorVest Variator
- VectorVest Watchdog
- StockCharts.com, Inc.
- Candle Patterns
- Candlestick Charting Explained
- Intermarket Technical Analysis
- John Murphy on Chart Analysis
- John Murphy's Chart Pattern Recognition
- John Murphy's Market Message
- MurphyExplainsMarketAnalysis-Intermarket Analysis
- MurphyExplainsMarketAnalysis-Visual Analysis
- StockCharts.com
- Technical Analysis of the Financial Markets
- The Visual Investor
