HOT TOPICS LIST
- MACD
- Fibonacci
- RSI
- Gann
- ADXR
- Stochastics
- Volume
- Triangles
- Futures
- Cycles
- Volatility
- ZIGZAG
- MESA
- Retracement
- Aroon
INDICATORS LIST
LIST OF TOPICS
PRINT THIS ARTICLE
by Koos van der Merwe
A possible short-term buy for a quick profit?
Position: Buy
Koos van der Merwe
Has been a technical analyst since 1969, and has worked as a futures and options trader with First Financial Futures in Johannesburg, South Africa.
PRINT THIS ARTICLE
RSI
Short-Term Buy For Career Education?
06/01/12 08:13:12 AMby Koos van der Merwe
A possible short-term buy for a quick profit?
Position: Buy
| On Friday, May 25, Career Education Corp. (CECO) rose 11.4% to $7.03, which was one of the largest percentage increases posted on NASDAQ. Career Education, through colleges, schools, and universities that are part of the CECO family, offers education to a diverse student population of approximately 100,000 students in a variety of career-oriented disciplines through online, in-person, and hybrid learning program offerings. |

|
| FIGURE 1. CECO, MONTHLY |
| Graphic provided by: AdvancedGET. |
| |
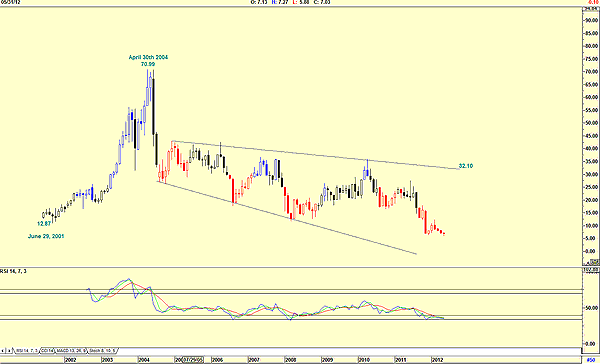
| Figure 1 is a monthly chart and shows how the price rose from $12.87 on June 29, 2001, to the high of $70.99 by April 30, 2004. From that high, the price steadily declined to its present price of $6.61. The chart shows that the decline had many corrections with positive short-term buy signals given by the relative strength index (RSI) with previous buy signals successfully given. With a new buy signal currently given, the possibility of a rise to the upper resistance trendline at $32.10 does exist. |

|
| FIGURE 2: CECO, DAILY |
| Graphic provided by: AdvancedGET. |
| |
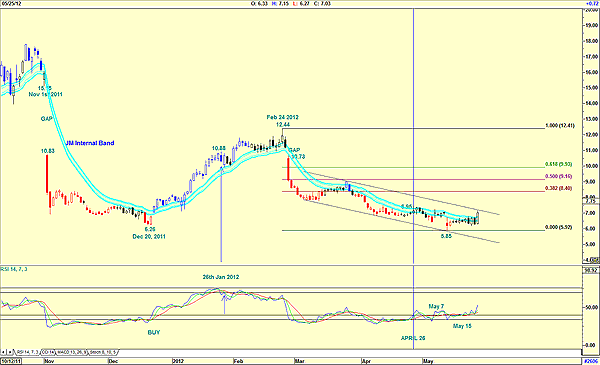
| Figure 2, a daily chart, shows how the share price fell with a gap on November 1, 2011, from $15.15 to $10.83, a fall of 28.51%. The share price continued to fall to a low of $6.26 by December 20, 2011, before starting to rise on an RSI buy signal to fill the gap. On January 26, 2012, when the share price was $10.88, the RSI suggested selling the share. The share price continued to rise to $12.44 before falling sharply on a gap on February 24. 2012. On April 26, the RSI gave a buy signal. The price rose briefly for one day to $6.95, then continued to fall to test the support line at $5.85. The RSI gave a second buy signal on May 7 and again on May 15 as the price moved sideways, eventually rising strongly on Friday, May 25, to test the upper resistance line. With the divergence buy on the RSI, the possibility of a break above the line looks very possible. What is the target? A Fibonacci retracement does give the targets of a 38.2% retracement at $8.40, a 50% retracement of $9.16 and a 61.8% retracement of $9.93. With the lower end of the gap at $10.73, the possibility of a rise to $10.73 to fill the gap is very possible. Finally, do note that the price has broken above the upper JM internal band, suggesting that a buy signal is on the cards. Career Education as a buy looks very interesting at the moment. |
Has been a technical analyst since 1969, and has worked as a futures and options trader with First Financial Futures in Johannesburg, South Africa.
| Address: | 3256 West 24th Ave |
| Vancouver, BC | |
| Phone # for sales: | 6042634214 |
| E-mail address: | petroosp@gmail.com |
Click here for more information about our publications!
Comments

Request Information From Our Sponsors
- VectorVest, Inc.
- Executive Premier Workshop
- One-Day Options Course
- OptionsPro
- Retirement Income Workshop
- Sure-Fire Trading Systems (VectorVest, Inc.)
- Trading as a Business Workshop
- VectorVest 7 EOD
- VectorVest 7 RealTime/IntraDay
- VectorVest AutoTester
- VectorVest Educational Services
- VectorVest OnLine
- VectorVest Options Analyzer
- VectorVest ProGraphics v6.0
- VectorVest ProTrader 7
- VectorVest RealTime Derby Tool
- VectorVest Simulator
- VectorVest Variator
- VectorVest Watchdog
- StockCharts.com, Inc.
- Candle Patterns
- Candlestick Charting Explained
- Intermarket Technical Analysis
- John Murphy on Chart Analysis
- John Murphy's Chart Pattern Recognition
- John Murphy's Market Message
- MurphyExplainsMarketAnalysis-Intermarket Analysis
- MurphyExplainsMarketAnalysis-Visual Analysis
- StockCharts.com
- Technical Analysis of the Financial Markets
- The Visual Investor
