HOT TOPICS LIST
- MACD
- Fibonacci
- RSI
- Gann
- ADXR
- Stochastics
- Volume
- Triangles
- Futures
- Cycles
- Volatility
- ZIGZAG
- MESA
- Retracement
- Aroon
INDICATORS LIST
LIST OF TOPICS
PRINT THIS ARTICLE
by Mike Carr, CMT
Seasonal tendencies can help deliver profits in some markets, help preserve profits in others, and even illustrate the "Sell in May" rule for stocks.
Position: Sell
Mike Carr, CMT
Mike Carr, CMT, is a member of the Market Technicians Association, and editor of the MTA's newsletter, Technically Speaking. He is also the author of "Smarter Investing in Any Economy: The Definitive Guide to Relative Strength Investing," and "Conquering the Divide: How to Use Economic Indicators to Catch Stock Market Trends."
PRINT THIS ARTICLE
SEASONAL TRADING
Seasonality Is Strong In Some Markets
06/01/12 08:06:13 AMby Mike Carr, CMT
Seasonal tendencies can help deliver profits in some markets, help preserve profits in others, and even illustrate the "Sell in May" rule for stocks.
Position: Sell
| Sometimes there are cycles in the market that can be traded. This is the idea behind a number of more esoteric market theories, but most of them are highly subjective. Gann is an example of a trading technique based on the existence of cycles, and practitioners must rely on judgment as to which cycle is the most important. Other cycle work uses a fixed time period, such as 40 days or the amount of time between full moons. With these cycles, traders look for a top or bottom in precise time windows. These ideas can work sometimes, but if the market really did top every 40 days or with some other degree of regularity, we would all be billionaire traders by now. Seasonal cycles should be based on underlying logic, and they can offer a guide as to when to expect a market turn based on economic fundamentals. An underlying logic makes seasonals different than other cycles, and seasonal peaks and troughs should repeat year after year. This is not a technique that provides pinpoint accuracy but still can be a valuable trading tool. |
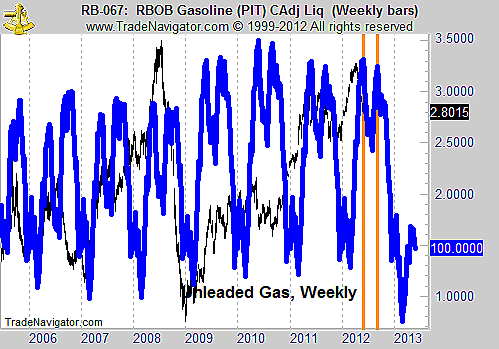
| Unleaded gas futures are an example of a market with strong seasonal tendencies. There are two distinct price peaks during the year (Figure 1). Seasonal trends for this chart are generated by averaging the price changes for a particular week each year and charting those averages as a line. These spikes are highlighted with orange vertical lines in the chart. At the end of May and in mid-August, prices in this contract spike. There is a logical reason for this. Both spikes appear shortly before holidays, at a time when more drivers than normal are on the road to enjoy the Memorial Day and Labor Day holidays. This is likely to happen year after year, and since there is an explanation for these spikes, we could develop a trading strategy around this idea. If unleaded gas is above its 50-day moving average in May or August, it would be a buy. Sell at the close on the Friday before the holiday. |

|
| FIGURE 1: RBOB, WEEKLY. Unleaded gasoline prices increase right before summer holidays when demand increases. |
| Graphic provided by: Trade Navigator. |
| |
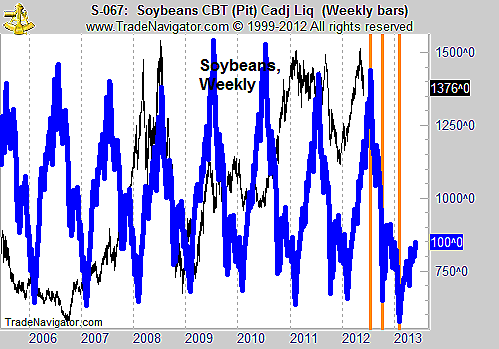
| Seasonals would also be expected in agricultural markets. Soybean futures prices are shown in Figure 2 and a spike along with two price troughs are highlighted with orange vertical lines. The spike occurs in the middle of July. Farmers generally have a good idea of how the harvest will be by July 4, and the selloff seen in this market, and other grain markets, would be consistent with markets gaining insight into what supply will look like. Troughs are seen in October and February. Markets will have confirmation of the supply in October and initial estimates of the amount of acreage to be planted in February. Given the large impact that weather can have on grain markets, a trading strategy for beans might be to close trades ahead of the volatility that is possible at these times of year or use a short-term strategy that takes advantage of volatility. |

|
| FIGURE 2: SOYBEANS, WEEKLY. Soybeans and other grains would be expected to have a seasonal pattern but can deviate from patterns based on the weather in any given year. |
| Graphic provided by: Trade Navigator. |
| |
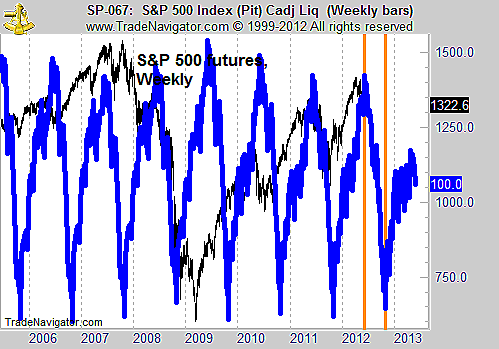
| Almost all traders wish they knew what stocks will do in the future, and there is a strong desire to make seasonals work. Unfortunately, there is no logical reason to explain the pattern seen in Figure 3. Prices peak at the end of May and have a tendency to bottom in October. This is consistent with the popular saying "Sell in May and go away." Without any logic to support a summer selloff, this pattern is more likely due to chance than the seasonal patterns seen in unleaded gas or soybeans. |

|
| FIGURE 3: S&P 500, WEEKLY. This chart of the S&P 500 shows that selling in May should be profitable, on average, over the long term. |
| Graphic provided by: Trade Navigator. |
| |
| Seasonals can be useful but should be used with caution and only when a logical explanation for the pattern exists. Without supporting logic, the seasonal is unreliable. Even with a logical reason, the seasonal should only be considered as one input into trading and the input could vary by market. In unleaded gas, the pattern points to a tradable strategy, while in grains it is more of a guide to volatility. In stocks, seasonals should be considered as a more than just a Wall Street saying and could be a starting point for developing a trading strategy. |
Mike Carr, CMT, is a member of the Market Technicians Association, and editor of the MTA's newsletter, Technically Speaking. He is also the author of "Smarter Investing in Any Economy: The Definitive Guide to Relative Strength Investing," and "Conquering the Divide: How to Use Economic Indicators to Catch Stock Market Trends."
| Website: | www.moneynews.com/blogs/MichaelCarr/id-73 |
| E-mail address: | marketstrategist@gmail.com |
Click here for more information about our publications!
Comments
Date: 06/08/12Rank: 5Comment:

Request Information From Our Sponsors
- StockCharts.com, Inc.
- Candle Patterns
- Candlestick Charting Explained
- Intermarket Technical Analysis
- John Murphy on Chart Analysis
- John Murphy's Chart Pattern Recognition
- John Murphy's Market Message
- MurphyExplainsMarketAnalysis-Intermarket Analysis
- MurphyExplainsMarketAnalysis-Visual Analysis
- StockCharts.com
- Technical Analysis of the Financial Markets
- The Visual Investor
- VectorVest, Inc.
- Executive Premier Workshop
- One-Day Options Course
- OptionsPro
- Retirement Income Workshop
- Sure-Fire Trading Systems (VectorVest, Inc.)
- Trading as a Business Workshop
- VectorVest 7 EOD
- VectorVest 7 RealTime/IntraDay
- VectorVest AutoTester
- VectorVest Educational Services
- VectorVest OnLine
- VectorVest Options Analyzer
- VectorVest ProGraphics v6.0
- VectorVest ProTrader 7
- VectorVest RealTime Derby Tool
- VectorVest Simulator
- VectorVest Variator
- VectorVest Watchdog
