HOT TOPICS LIST
- MACD
- Fibonacci
- RSI
- Gann
- ADXR
- Stochastics
- Volume
- Triangles
- Futures
- Cycles
- Volatility
- ZIGZAG
- MESA
- Retracement
- Aroon
INDICATORS LIST
LIST OF TOPICS
PRINT THIS ARTICLE
by Bruce Tintelnot
No one can immediately recognize when retracements are beginning or how long they will last, but some methods have been developed that attempt to help traders and analysts arrive at estimations.
Position: N/A
Bruce Tintelnot
Bruce Tintelnot is a writer and researcher in the area of business, particularly investing and the economy. His qualifications include a bachelor's degree in business administration with a financial major, online trading experience in the stock and foreign currency markets with a good knowledge of technical analysis and fundamental analysis.
PRINT THIS ARTICLE
RETRACEMENT
A Look At Retracements
05/30/12 09:49:12 AMby Bruce Tintelnot
No one can immediately recognize when retracements are beginning or how long they will last, but some methods have been developed that attempt to help traders and analysts arrive at estimations.
Position: N/A
| It's fairly obvious that the price changes on the charts for capital markets can't progress in straight lines. In fact, it's just the opposite. When market prices move in one direction forming a trend, there are always peaks and troughs along the way. These seem to mark the areas where bullish investors seem to be struggling to reach higher highs before catching their breaths while the sellers take over to reach lower lows until their numbers dwindle for renewed buying. These reversals that occur after a long movement of prices in one direction are retracements, and methods have been devised to recognize them and estimate their scope. These can be helpful in determining when to buy or sell in a market. |
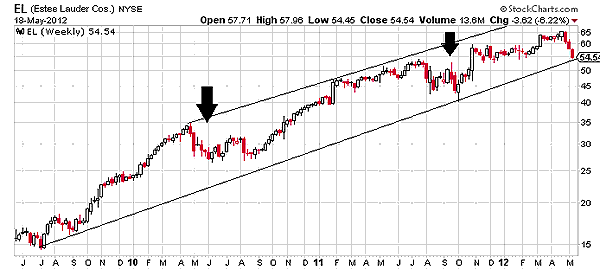
| 1) There are not many characteristics that help traders attempt to recognize retracements. Recognizable chart patterns are usually absent aside from candlestick chart formations that quite often have long shadows like spinning tops and various patterns like engulfing patterns and the morning doji star. They occur after a long period of price movements in one direction and then only last for a short time, often only a few weeks on a daily chart. See Figure 1. |

|
| FIGURE 1: ESTEE LAUDER, WEEKLY |
| Graphic provided by: StockCharts.com. |
| Graphic provided by: Author using Microsoft Paint. |
| |
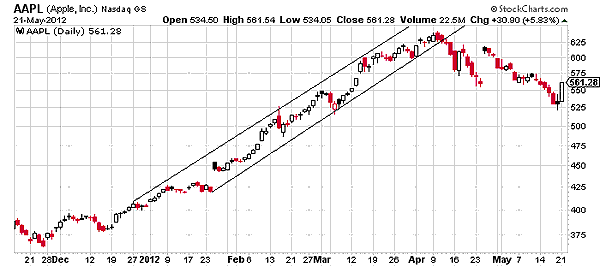
| 2) When a trendline is drawn using the two highest prices, a similar line can be drawn using the two lowest prices that encloses the prices in a price channel. This can be used for estimating the high and low extremes that prices can reach before reversing direction as they follow the trend. A breakout can signal a trend reversal or it can be a false breakout and return inside the channel. See Figure 2. |

|
| FIGURE 2: APPLE, INC., DAILY |
| Graphic provided by: StockCharts.com. |
| Graphic provided by: Author using Microsoft Paint. |
| |
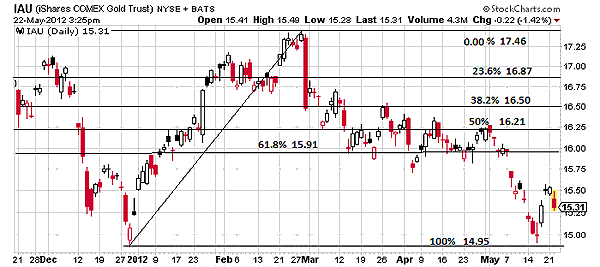
| 3) Pivot points can be calculated to determine the most likely areas that will serve as support and resistance for retracements. The most widely used system for calculating pivot points is the five-point system that uses the previous day's high, low, and close to calculate the current pivot point, which is then used for calculating two resistance and two support levels for a total of five calculations. See Figure 3. |

|
| FIGURE 3: IAU, DAILY |
| Graphic provided by: StockCharts.com. |
| Graphic provided by: Author using Microsoft Paint. |
| |
| 4) The 50% principle states that the normal course of trend retracements will occur that extend to one-half to two-thirds of the previous upward movement. The Fibonacci retracement is a tool that seems to elaborate on this principle, but it was actually based on a "golden ratio" studied by the 13th-century mathematician Fibonacci. This tool is good for any type of chart and divides the low and the high prices of the previous trend, or price movement, into various levels that are potential support and resistance for retracements. They are arranged according to the Fibonacci ratios of 23.6%, 38.2%, 50%, 61.8%, and 100%. |
Bruce Tintelnot is a writer and researcher in the area of business, particularly investing and the economy. His qualifications include a bachelor's degree in business administration with a financial major, online trading experience in the stock and foreign currency markets with a good knowledge of technical analysis and fundamental analysis.
| Title: | Freelance Writer |
| Website: | textwriter2.webs.com |
| E-mail address: | brucetintelnot@aol.com |
Click here for more information about our publications!
Comments

Request Information From Our Sponsors
- StockCharts.com, Inc.
- Candle Patterns
- Candlestick Charting Explained
- Intermarket Technical Analysis
- John Murphy on Chart Analysis
- John Murphy's Chart Pattern Recognition
- John Murphy's Market Message
- MurphyExplainsMarketAnalysis-Intermarket Analysis
- MurphyExplainsMarketAnalysis-Visual Analysis
- StockCharts.com
- Technical Analysis of the Financial Markets
- The Visual Investor
- VectorVest, Inc.
- Executive Premier Workshop
- One-Day Options Course
- OptionsPro
- Retirement Income Workshop
- Sure-Fire Trading Systems (VectorVest, Inc.)
- Trading as a Business Workshop
- VectorVest 7 EOD
- VectorVest 7 RealTime/IntraDay
- VectorVest AutoTester
- VectorVest Educational Services
- VectorVest OnLine
- VectorVest Options Analyzer
- VectorVest ProGraphics v6.0
- VectorVest ProTrader 7
- VectorVest RealTime Derby Tool
- VectorVest Simulator
- VectorVest Variator
- VectorVest Watchdog
