HOT TOPICS LIST
- MACD
- Fibonacci
- RSI
- Gann
- ADXR
- Stochastics
- Volume
- Triangles
- Futures
- Cycles
- Volatility
- ZIGZAG
- MESA
- Retracement
- Aroon
INDICATORS LIST
LIST OF TOPICS
PRINT THIS ARTICLE
by Mike Carr, CMT
Traders are looking for ways to forecast the future from the recent past. Some successful traders develop trading rules based on what they see in the markets.
Position: Buy
Mike Carr, CMT
Mike Carr, CMT, is a member of the Market Technicians Association, and editor of the MTA's newsletter, Technically Speaking. He is also the author of "Smarter Investing in Any Economy: The Definitive Guide to Relative Strength Investing," and "Conquering the Divide: How to Use Economic Indicators to Catch Stock Market Trends."
PRINT THIS ARTICLE
RSI
Turning Market Observations Into Trading Strategies
05/24/12 01:44:48 PMby Mike Carr, CMT
Traders are looking for ways to forecast the future from the recent past. Some successful traders develop trading rules based on what they see in the markets.
Position: Buy
| Rules-based traders can include some traders who almost appear to be making discretionary market calls. Trading with rules is usually thought of as buying and selling done with indicators. For example, moving averages are easily adapted to become a rules-based strategy. Using the 50-day and 200-day moving averages, traders can buy when the 50-day average crosses above the 200-day average and sell when the shorter average falls below the longer average. This is easily tested and traders can know in advance what the probabilities of winning trades are while knowing they have a disciplined approach to deal with any market conditions. Other rules-based systems are more adaptive. Technical analysis is based on the premise that history repeats itself. That is why so many traders devote time to testing rules that are based on indicators. This is the traditional approach used in testing. Other traders let the current market define the conditions they will test. This idea might be difficult to conceptualize for some, so an example might help make it easier to understand. |

|
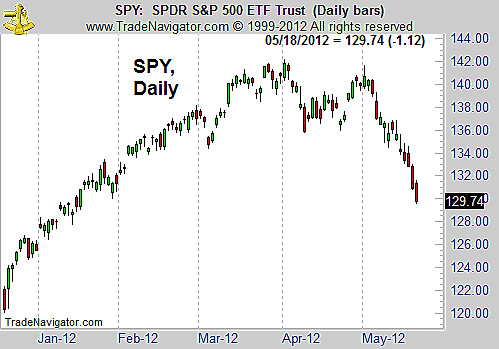
| FIGURE 1: SPY, DAILY. Short-term system development can begin with a simple chart and an observation. In this example, a trader notices the market has fallen sharply. |
| Graphic provided by: Trade Navigator. |
| |
| In mid-May, the market trend was down and each day looked increasingly bearish. All a trader knows for sure is what they can see in a chart like Figure 1. The chart may have formed a topping pattern, with some traders seeing a roughly drawn head & shoulders or a rectangle broken to the downside. Reading chart patterns is a subjective exercise, with many different interpretations possible at any given time. One thing is clear in the daily chart of SPY, and that is that prices have fallen sharply. The knowledge that prices have fallen sets up a possible trading rule. Traders could ask, "What has SPY done in the past after a decline like this?" SPY is actually down more than 6% in the last two weeks and more than 8% in 13 days. Using two weeks as a lookback period, traders can test to see what has happened in the past after a 6% decline. A possible way to test for this condition is to buy when the most recent close is less than 94% of the close 10 days ago. A simple time exit with holding periods from one day to 40 days offers some insight into the state of the market after this happens. Over all of those time frames, SPY moves higher but the average trade size is very small, less than 2% over almost all time frames, and the risks are generally high. The test results show that after a sharp market drop, there is often a small recovery in price, but often another move down follows the initial decline. |
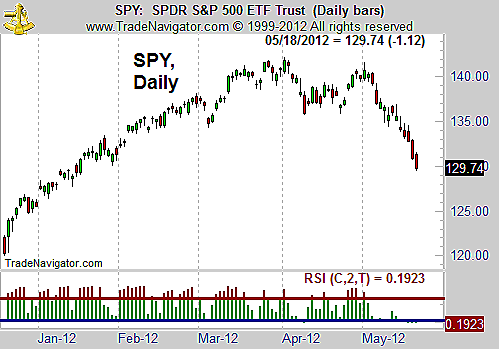
| The trader may also realize that the market is oversold after the early May decline. This can be measured with a variety of indicators. In Figure 2, the two-day relative strength index (RSI) has been added to the chart. Generally, a level below 5 indicates an oversold market. At the close on May 18, RSI(2) reached 0.19. Buying when the market gets this oversold (RSI(2) < 1) delivers winning trades at least 70% of the time over the testing time frames. |

|
| FIGURE 2: SPY, DAILY. Adding an indicator helps refine the market picture. In this case, RSI(2) is about as oversold as possible, since it can never fall below zero and it is at 0.19. |
| Graphic provided by: Trade Navigator. |
| |
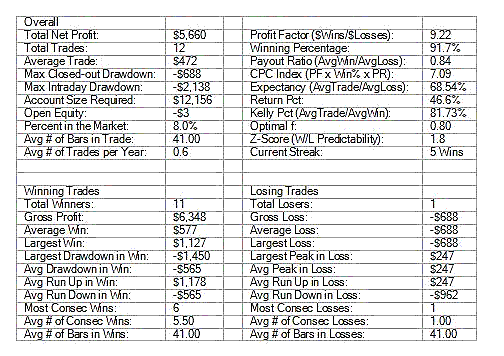
| Test results for a two-month holding period are shown in Figure 3. Testing deducted a total of $20 per trade for commissions. Buys were assumed to be done on the open and exits are taken at the open the day after the desired holding period is reached. |

|
| FIGURE 3: PERFORMANCE SUMMARY. Testing shows this is a rare but profitable trade setup. |
| Graphic provided by: Trade Navigator. |
| |
| This is an adaptive rules-based approach. Traders can look at a chart and program what they see. Based on the results, they can initiate a trade with the same level of confidence a traditional system would offer. However, traders need to be careful they do not curve-fit the rules. If there are more than three or four conditions, then the future is very unlikely to be like the past. |
Mike Carr, CMT, is a member of the Market Technicians Association, and editor of the MTA's newsletter, Technically Speaking. He is also the author of "Smarter Investing in Any Economy: The Definitive Guide to Relative Strength Investing," and "Conquering the Divide: How to Use Economic Indicators to Catch Stock Market Trends."
| Website: | www.moneynews.com/blogs/MichaelCarr/id-73 |
| E-mail address: | marketstrategist@gmail.com |
Click here for more information about our publications!
Comments
Date: 05/31/12Rank: 5Comment: Clearly stated, backtested, quantified test results.
Excellent!

Request Information From Our Sponsors
- VectorVest, Inc.
- Executive Premier Workshop
- One-Day Options Course
- OptionsPro
- Retirement Income Workshop
- Sure-Fire Trading Systems (VectorVest, Inc.)
- Trading as a Business Workshop
- VectorVest 7 EOD
- VectorVest 7 RealTime/IntraDay
- VectorVest AutoTester
- VectorVest Educational Services
- VectorVest OnLine
- VectorVest Options Analyzer
- VectorVest ProGraphics v6.0
- VectorVest ProTrader 7
- VectorVest RealTime Derby Tool
- VectorVest Simulator
- VectorVest Variator
- VectorVest Watchdog
- StockCharts.com, Inc.
- Candle Patterns
- Candlestick Charting Explained
- Intermarket Technical Analysis
- John Murphy on Chart Analysis
- John Murphy's Chart Pattern Recognition
- John Murphy's Market Message
- MurphyExplainsMarketAnalysis-Intermarket Analysis
- MurphyExplainsMarketAnalysis-Visual Analysis
- StockCharts.com
- Technical Analysis of the Financial Markets
- The Visual Investor
