HOT TOPICS LIST
- MACD
- Fibonacci
- RSI
- Gann
- ADXR
- Stochastics
- Volume
- Triangles
- Futures
- Cycles
- Volatility
- ZIGZAG
- MESA
- Retracement
- Aroon
INDICATORS LIST
LIST OF TOPICS
PRINT THIS ARTICLE
by Donald W. Pendergast, Jr.
Shares of Analog Devices have been holding up well, despite the recent selloffs in the broad US markets.
Position: N/A
Donald W. Pendergast, Jr.
Donald W. Pendergast is a financial markets consultant who offers specialized services to stock brokers and high net worth individuals who seek a better bottom line for their portfolios.
PRINT THIS ARTICLE
TECHNICAL ANALYSIS
ADI Low-Risk Buy Setup?
05/25/12 12:23:38 PMby Donald W. Pendergast, Jr.
Shares of Analog Devices have been holding up well, despite the recent selloffs in the broad US markets.
Position: N/A
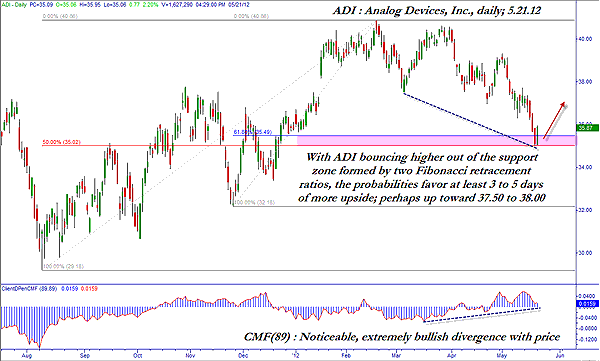
| Anytime a large-cap stock manages to buck the dominant broad market trend and in a very noticeable way, it might be a good time to take a closer look at its money flow, trend, and fundamental outlook to see if new long trading setups in the stock are worth considering. Here's a look at an interesting, potentially low-risk buy setup in shares of Analog Devices, Inc. (ADI). See Figures 1 and 2. |

|
| FIGURE 1: ADI, DAILY. When a strong intraday reversal prints at the same time that a stock is testing a strong support zone, even as the money flow equation remains bullish, the odds for a tradable rally are very good. |
| Graphic provided by: TradeStation. |
| |
| While a runup of 39.6% in a six-month time span might seem modest for a volatile small-cap stock, for a large-cap, widely held issue like ADI, such a move is very impressive indeed. ADI launched higher after making a major low of 29.23 on August 9, 2012, just about the time that traders and investors everywhere were beginning to wonder if the end of western civilization might be at hand as the European debt mess began to get out of hand. It took a while for ADI's subsequent six-month rally to unfold with some sharp pullbacks along the way, but the stock ultimately hit a high of 40.83 on February 17, 2012. Since then, however, ADI has sold off steadily, especially after the failed attempt at a new high in late March 2012, dropping about 12% before finally turning higher on May 21, 2012. There's not anything magical or mysterious going on here, nor is there any secret system or newly discovered technical indicator or concept to reveal, either. No, the bottom-line reasoning for going long ADI here is really simple: 1. The stock had been in a substantial uptrend for six months and has sold off to a major Fibonacci confluence support zone. This support zone near 35.00 has managed to help ADI bounce higher. 2. The stock's long-term money flow (based on its 89-period Chaikin money flow histogram, CMF[89]) is manifesting an extremely bullish price/money flow divergence. First off, note that the histogram has been steadily rising, even as price has pulled back toward support. Also note that the histogram is still well above its zero line, implying major accumulation is already under way. Clearly, at least some smart money interests still see a bright future for ADI's share price in the next few months. 3. The entire US stock market in showing similar signs of reversing higher from support, and after taking a beating over the last month or so, it appears that the time is ripe for a relief rally of some magnitude to commence. |

|
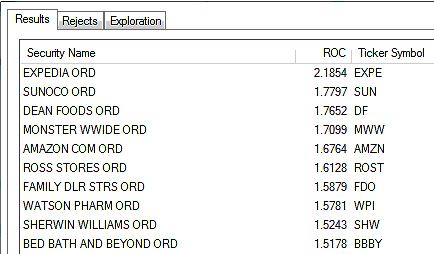
| FIGURE 2: LARGE CAPS. The top 10 large caps are outperforming the .SPX over the past 13 weeks. |
| Graphic provided by: TradeStation. |
| |
| Here is one way to consider playing ADI here: If Monday's high of 35.95 is taken out, go long and immediately start running a three-bar trailing stop of the daily lows until the trade stops out as a loser or a winner. If ADI can manage a rise toward 38.00, consider running a two-bar trailing stop of the daily lows so you can lock in more of any open profits you may acquire on the trade. And, of course, limit your account risk on the trade to no more than 1% to 2% just in case the trade fails to gain any traction at all and simply begins to run back south again. Trade management and risk control is at least as important, if not more, that your actual entry triggers are chosen to open the trade, so be sure to give plenty of thought to how you plan to go about this, as it can help you become a less frustrated, more profitable trader over time. |
Donald W. Pendergast is a financial markets consultant who offers specialized services to stock brokers and high net worth individuals who seek a better bottom line for their portfolios.
| Title: | Writer, market consultant |
| Company: | Linear Trading Systems LLC |
| Jacksonville, FL 32217 | |
| Phone # for sales: | 904-239-9564 |
| E-mail address: | lineartradingsys@gmail.com |
Traders' Resource Links | |
| Linear Trading Systems LLC has not added any product or service information to TRADERS' RESOURCE. | |
Click here for more information about our publications!
PRINT THIS ARTICLE

|

Request Information From Our Sponsors
- StockCharts.com, Inc.
- Candle Patterns
- Candlestick Charting Explained
- Intermarket Technical Analysis
- John Murphy on Chart Analysis
- John Murphy's Chart Pattern Recognition
- John Murphy's Market Message
- MurphyExplainsMarketAnalysis-Intermarket Analysis
- MurphyExplainsMarketAnalysis-Visual Analysis
- StockCharts.com
- Technical Analysis of the Financial Markets
- The Visual Investor
- VectorVest, Inc.
- Executive Premier Workshop
- One-Day Options Course
- OptionsPro
- Retirement Income Workshop
- Sure-Fire Trading Systems (VectorVest, Inc.)
- Trading as a Business Workshop
- VectorVest 7 EOD
- VectorVest 7 RealTime/IntraDay
- VectorVest AutoTester
- VectorVest Educational Services
- VectorVest OnLine
- VectorVest Options Analyzer
- VectorVest ProGraphics v6.0
- VectorVest ProTrader 7
- VectorVest RealTime Derby Tool
- VectorVest Simulator
- VectorVest Variator
- VectorVest Watchdog
