HOT TOPICS LIST
- MACD
- Fibonacci
- RSI
- Gann
- ADXR
- Stochastics
- Volume
- Triangles
- Futures
- Cycles
- Volatility
- ZIGZAG
- MESA
- Retracement
- Aroon
INDICATORS LIST
LIST OF TOPICS
PRINT THIS ARTICLE
by Bob Hunt
As helpful as Pivot System levels often are, they have one significant drawback--they are calculated from the prior day's price action and may not accurately reflect recent changes in market psychology.
Position: N/A
Bob Hunt
Creator of the Pattern Trapper On-Line Trading Course and editor of The Pattern Trapper Commodities Newsletter.
PRINT THIS ARTICLE
DAY TRADING
Technical Tools For Day Traders: Part 3: Dynamic Support & Resistance Levels
06/11/02 12:36:24 PMby Bob Hunt
As helpful as Pivot System levels often are, they have one significant drawback--they are calculated from the prior day's price action and may not accurately reflect recent changes in market psychology.
Position: N/A
| Effective intraday trading requires a means of identifying support and resistance that can easily adapt and accurately represent price activity under rapidly changing market conditions. The 20-period exponential moving average (EMA) can be used to create "dynamic" levels of support and resistance. Unlike the Pivot System's support and resistant levels that remain constant throughout the day, the 20-period EMA changes in accordance with more immediate changes in price. This feature makes them a very effective tool, especially when significant shifts in market psychology occur, either between Pivot System levels or after large thrusting impulse moves. |
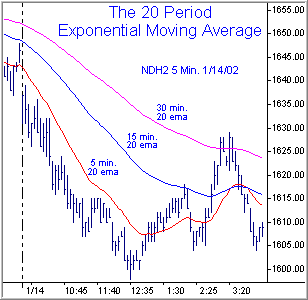
| My principle intraday chart reference is the five minute time frame with frequent note of other periods as market conditions warrant. For this reason, the 5-minute 20-period EMA is my most often referenced moving average. However, it is also helpful to additionally graph both the 15- and 30-minute charts onto the same 5-minute chart. This is accomplished by plotting the following values: 5-min. 20EMA -- plot a 20-period exponential moving average. 15-min. 20EMA -- plot a 60-period exponential moving average (15/5*20) 30-min. 20EMA -- plot a 120-period exponential moving average (30/5*20) It is important to recognize that the 15- and 30-minute values arrived at with this method are not exact and precise representation of the corresponding 15- and 30-minute 20EMAs, but for purposes of identifying potential support and resistance levels, you will find the technique quite useful. |

|
| Figure 1: Five-minute Nasdaq futures chart, March 2002, showing 5-, 15-, and 30-min. 20-period EMAs. |
| Graphic provided by: TradeStation. |
| |
| The 20-period EMA is treated as we would any other potential support or resistance level. In congested trading range market conditions, these levels can be violated rather easily. However, when price begins to trend, the 20EMA can be a valuable aid in determining appropriate areas in which to take action either by establishing new positions . . . or baling out of existing ones. |
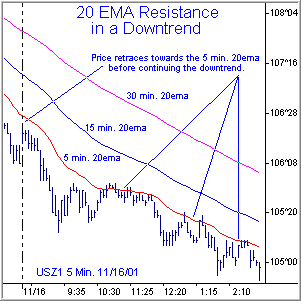
 Figure 2: Five-minute intraday 30-year Bond chart, December 2001, showing 5-, 15-, and 30-min. 20-period EMAs. One of the more frequent uses of this indicator comes into play when you began a particular trading day expecting the trend that was established the previous day to continue. A common strategy on such days is to look for an opportunity to enter on the first retracement move which takes price back towards a likely support (if in an uptrend) or resistance (if in a downtrend). The first level of support or resistance encountered is likely to be that of either the 5-minute 20EMA, the 15-minute 20EMA, or the 30-minute 20EMA. It is important to keep an eye on these levels when you are expecting trend continuation. Once a trend has been established, it is very often the case that one of these levels (most often the 5-minute 20EMA) will contain the price action quite effectively. |
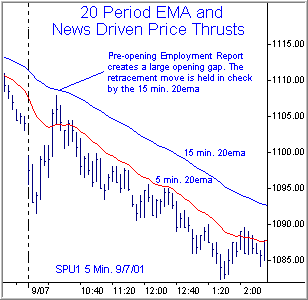
 Figure 3: Five-minute Standard & Poors Futues S&P 500 chart, showing 5- and 15-min. 20-period EMAs. The 20-period EMA can also come into play immediately following large, news-driven price thrusts. Trading conditions can often be so volatile during such periods that I generally discourage any sort of participation until the initial hysteria subsides. Typically, the strong impulse thrust that accompanies such events are the beginning statement in a new trend move. Such price behavior will usually undergo some sort of retracement activity before an advance of significance takes hold. Again, the 20-period EMA is an excellent tool for gauging the degree of retracement and likely return to the trend. As stated earlier, the "dynamic" characteristics of the 20-period EMA make the indicator an important tool. Its ability to react in accordance to immediate changes in the market environment make it a valuable aid in creating structure out of essentially unstructured events. |
Creator of the Pattern Trapper On-Line Trading Course and editor of The Pattern Trapper Commodities Newsletter.
| Company: | The Pattern Trapper |
| Website: | www.patterntrapper.com |
| E-mail address: | RHunt@PatternTrapper.com |
Traders' Resource Links | |
| The Pattern Trapper has not added any product or service information to TRADERS' RESOURCE. | |
Click here for more information about our publications!
Comments
Date: 06/13/02Rank: 2Comment: I don t understand why you think the psychology of intraday scalping is anything like swing trading where pivots play a stronger role. Although I think it is fair to use piovts on an intraday level relative to opening range breakouts - but beyond that I see the intraday crowd reacting to momentum - so I would think momentum is the key for intraday trading

Request Information From Our Sponsors
- StockCharts.com, Inc.
- Candle Patterns
- Candlestick Charting Explained
- Intermarket Technical Analysis
- John Murphy on Chart Analysis
- John Murphy's Chart Pattern Recognition
- John Murphy's Market Message
- MurphyExplainsMarketAnalysis-Intermarket Analysis
- MurphyExplainsMarketAnalysis-Visual Analysis
- StockCharts.com
- Technical Analysis of the Financial Markets
- The Visual Investor
- VectorVest, Inc.
- Executive Premier Workshop
- One-Day Options Course
- OptionsPro
- Retirement Income Workshop
- Sure-Fire Trading Systems (VectorVest, Inc.)
- Trading as a Business Workshop
- VectorVest 7 EOD
- VectorVest 7 RealTime/IntraDay
- VectorVest AutoTester
- VectorVest Educational Services
- VectorVest OnLine
- VectorVest Options Analyzer
- VectorVest ProGraphics v6.0
- VectorVest ProTrader 7
- VectorVest RealTime Derby Tool
- VectorVest Simulator
- VectorVest Variator
- VectorVest Watchdog
