HOT TOPICS LIST
- MACD
- Fibonacci
- RSI
- Gann
- ADXR
- Stochastics
- Volume
- Triangles
- Futures
- Cycles
- Volatility
- ZIGZAG
- MESA
- Retracement
- Aroon
INDICATORS LIST
LIST OF TOPICS
PRINT THIS ARTICLE
by Koos van der Merwe
Canadian Apartment Properties Real Estate Investment Trus (CAPREIT) is a share that should be looked at. With Warren Buffett stating that we would do better investing in property, this is a share worth looking at.
Position: Accumulate
Koos van der Merwe
Has been a technical analyst since 1969, and has worked as a futures and options trader with First Financial Futures in Johannesburg, South Africa.
PRINT THIS ARTICLE
A Look At Canadian Property
05/29/12 08:48:49 AMby Koos van der Merwe
Canadian Apartment Properties Real Estate Investment Trus (CAPREIT) is a share that should be looked at. With Warren Buffett stating that we would do better investing in property, this is a share worth looking at.
Position: Accumulate
| As one of Canada's largest residential landlords, CAPREIT is a growth-oriented investment trust owning interests in 30,878 residential units, located in near major urban centers across Canada. At present it is offering a monthly yield of only 4.7%, suggesting that it may be worth looking at should the price fall when the percentage yield improves. Or we could look at it as a growth share. |

|
| FIGURE 1: WEEKLY |
| Graphic provided by: AdvancedGET. |
| |
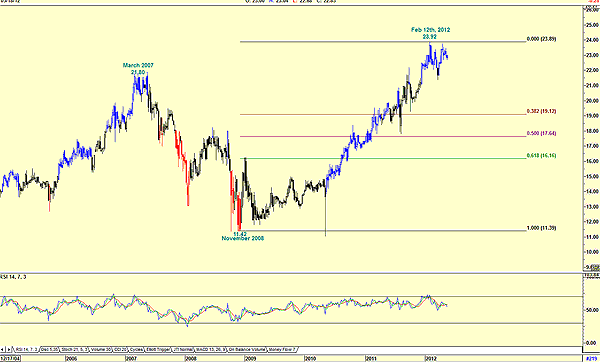
| Figure 1 is a weekly chart and shows how the price rose from a low of $11.42 on November 2008 to a high of $23.92 by February 2012. Over that period, the relative strength index (RSI) rose with the rise in the share price, giving a sell signal at the high of $23.92 on February 2012. Fibonacci retracement does suggest that the price could drop to $19.12, suggesting that the yield could be 5.88% (23.92/19.12 x 4.7 = 5.88). Will the share drop to this level? A look at the daily chart could tell us. |

|
| FIGURE 2: DAILY |
| Graphic provided by: OmniTrader. |
| |
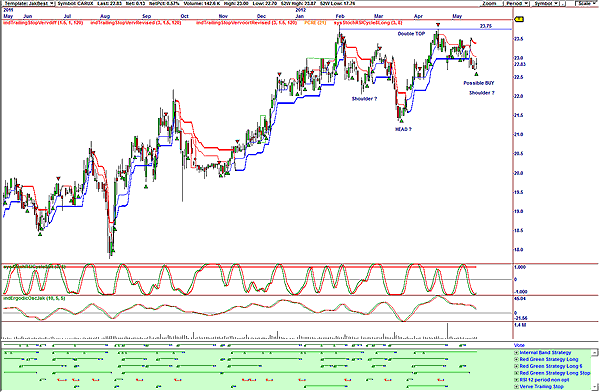
| Figure 2 is the one that brought the share to my attention. It is a daily OmniTrader chart with the strategies I developed to assist me in identifying possible buys. The chart shows the vote line, which is a summation of the strategies I developed to assist me in identifying shares to look at. At the moment the vote line is not giving me a buy signal, but the stochastic RSI has given me a buy signal. Previous green arrows on the chart shows that the signal has been reasonably accurate. What does catch the eye is the possible formation of an inverted head & shoulder formation. Now this is unusual, because an inverted head & shoulder usually occurs after a share has fallen to a major bottom, not at a top. What is also interesting is the double-top formation at $23.75. To help me in my decision, let us look at the JM internal band in Figure 3. |

|
| FIGURE 3: DAILY, SHOWING JM INTERNAL BAND |
| Graphic provided by: AdvancedGET. |
| |
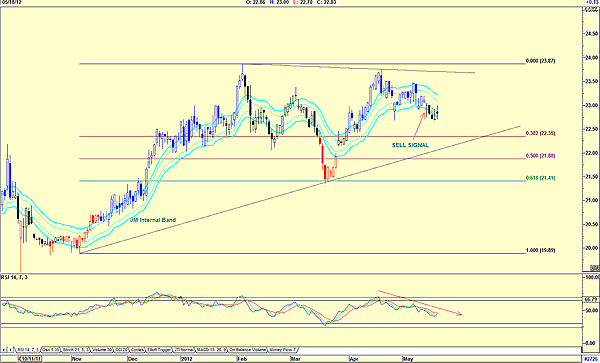
| Figure 3 shows a falling RSI, with a sell signal given by the JM internal band on May 14, 2012. On that day, the XTL trend indicator changed the candlestick from blue to black, suggesting indecision. This is a share to place on the watchlist. Should the price fall to the 38.2% Fibonacci retracement level of $22.35, it could suggest a buy signal if the RSI falls below the 32 level and then recovers, or of course, should the price break above the upper JM internal band line. With Warren Buffett saying that we should invest in property, this is a share to place on your watchlist. |
Has been a technical analyst since 1969, and has worked as a futures and options trader with First Financial Futures in Johannesburg, South Africa.
| Address: | 3256 West 24th Ave |
| Vancouver, BC | |
| Phone # for sales: | 6042634214 |
| E-mail address: | petroosp@gmail.com |
Click here for more information about our publications!
PRINT THIS ARTICLE

Request Information From Our Sponsors
- StockCharts.com, Inc.
- Candle Patterns
- Candlestick Charting Explained
- Intermarket Technical Analysis
- John Murphy on Chart Analysis
- John Murphy's Chart Pattern Recognition
- John Murphy's Market Message
- MurphyExplainsMarketAnalysis-Intermarket Analysis
- MurphyExplainsMarketAnalysis-Visual Analysis
- StockCharts.com
- Technical Analysis of the Financial Markets
- The Visual Investor
- VectorVest, Inc.
- Executive Premier Workshop
- One-Day Options Course
- OptionsPro
- Retirement Income Workshop
- Sure-Fire Trading Systems (VectorVest, Inc.)
- Trading as a Business Workshop
- VectorVest 7 EOD
- VectorVest 7 RealTime/IntraDay
- VectorVest AutoTester
- VectorVest Educational Services
- VectorVest OnLine
- VectorVest Options Analyzer
- VectorVest ProGraphics v6.0
- VectorVest ProTrader 7
- VectorVest RealTime Derby Tool
- VectorVest Simulator
- VectorVest Variator
- VectorVest Watchdog
