HOT TOPICS LIST
- MACD
- Fibonacci
- RSI
- Gann
- ADXR
- Stochastics
- Volume
- Triangles
- Futures
- Cycles
- Volatility
- ZIGZAG
- MESA
- Retracement
- Aroon
INDICATORS LIST
LIST OF TOPICS
PRINT THIS ARTICLE
by Koos van der Merwe
The market has been correcting down. The maxim is to buy on a correction, but what do you buy?
Position: Accumulate
Koos van der Merwe
Has been a technical analyst since 1969, and has worked as a futures and options trader with First Financial Futures in Johannesburg, South Africa.
PRINT THIS ARTICLE
HEAD & SHOULDERS
SunOpta Canada A Buy?
05/24/12 10:17:28 AMby Koos van der Merwe
The market has been correcting down. The maxim is to buy on a correction, but what do you buy?
Position: Accumulate
| Every morning lately, before the market opens, the futures suggest a positive opening, but the market finishes negative. We all know why. If it it isn't Greece, then it must be Spain, or Portugal, or... One country that does appear to be weathering the storm is Canada, so a look at Canadian shares brought up this cheapie stock. SunOpta is a company that focuses on natural, organic, and specialty foods. At the end of March, it announced its quarterly results, which were a year-over-year increase of 5.4%. So with a current price of $5.95, buying the share may be a worthwhile investment. What do the charts say? |

|
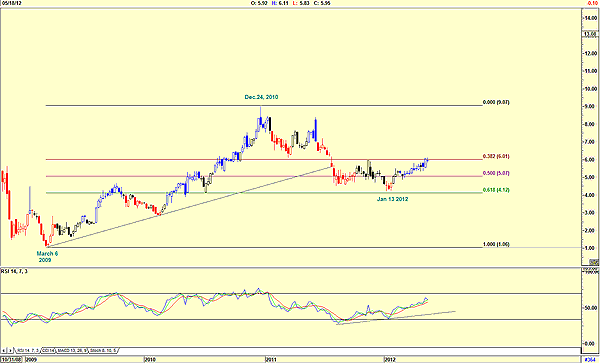
| FIGURE 1: SUNOPTA, WEEKLY |
| Graphic provided by: AdvancedGET. |
| |
| Figure 1, a weekly chart, shows the following. The price moved from a low of $1.06 on March 6 to a high of $9.07 by December 24, 2010. The price then fell to $4.12 by January 13, 2012, a 61.8% retracement. From that level, the price has moved up to the 38.2% retracement level, forming a double top. A break above this level will suggest a buy signal. With the relative strength index (RSI) showing strength, a buy may be on the cards. To determine this, we then look at a daily chart. |

|
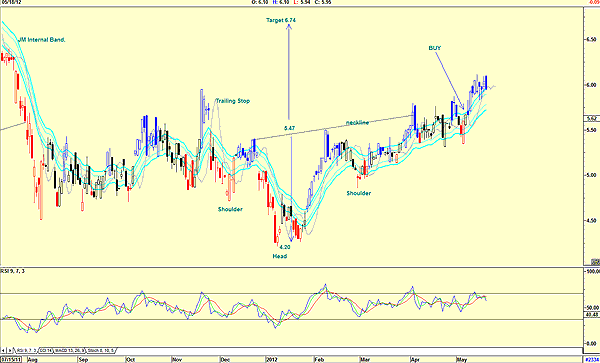
| FIGURE 2: SUNOPTA, DAILY |
| Graphic provided by: AdvancedGET. |
| |
| The daily chart shown in Figure 2 shows how the price dropped to $4.20 and has now formed what appears to be an inverse head & shoulder formation. The price has broken above the neckline, suggesting a target of $6.74. With a buy signal given by its move above the JM internal band as shown, we could watch the share and purchase it on any correction. A look at the chart shows that its daily volatility could present an opportunity at any time. At the moment ,the RSI, and here I have used a nine period, is suggesting weakness, so we could expect the price to break below the trailing stop-loss line. The trailing stop is a three-day moving average of the pivot point of four days previous. The price is still blue, which means that the XTL trend indicator is positive. With a suggested target of $6.74, and the RSI and trailing stop suggesting a correction in the offing, we should put any purchase of the share on hold. However, the share should be watched for a future buy, should the price fall to the lower JM band line, and then rise and break above the upper JM band line. |
Has been a technical analyst since 1969, and has worked as a futures and options trader with First Financial Futures in Johannesburg, South Africa.
| Address: | 3256 West 24th Ave |
| Vancouver, BC | |
| Phone # for sales: | 6042634214 |
| E-mail address: | petroosp@gmail.com |
Click here for more information about our publications!
PRINT THIS ARTICLE

Request Information From Our Sponsors
- StockCharts.com, Inc.
- Candle Patterns
- Candlestick Charting Explained
- Intermarket Technical Analysis
- John Murphy on Chart Analysis
- John Murphy's Chart Pattern Recognition
- John Murphy's Market Message
- MurphyExplainsMarketAnalysis-Intermarket Analysis
- MurphyExplainsMarketAnalysis-Visual Analysis
- StockCharts.com
- Technical Analysis of the Financial Markets
- The Visual Investor
- VectorVest, Inc.
- Executive Premier Workshop
- One-Day Options Course
- OptionsPro
- Retirement Income Workshop
- Sure-Fire Trading Systems (VectorVest, Inc.)
- Trading as a Business Workshop
- VectorVest 7 EOD
- VectorVest 7 RealTime/IntraDay
- VectorVest AutoTester
- VectorVest Educational Services
- VectorVest OnLine
- VectorVest Options Analyzer
- VectorVest ProGraphics v6.0
- VectorVest ProTrader 7
- VectorVest RealTime Derby Tool
- VectorVest Simulator
- VectorVest Variator
- VectorVest Watchdog
